A practical decision guide for buying controlled weakness inside strong trends
A pullback entry is not buying because price has fallen. It is buying a strong stock or coin after controlled weakness, once buyers show evidence that they are returning.
The 10/20 EMA zone is the area of interest. The turn back up is the entry trigger. The pullback low, 20 EMA, or failed breakout level is the invalidation area.
Best setupStrong trend first
Buy area10/20 EMA or retest
TriggerBuyers reappear
InvalidationSupport fails on volume
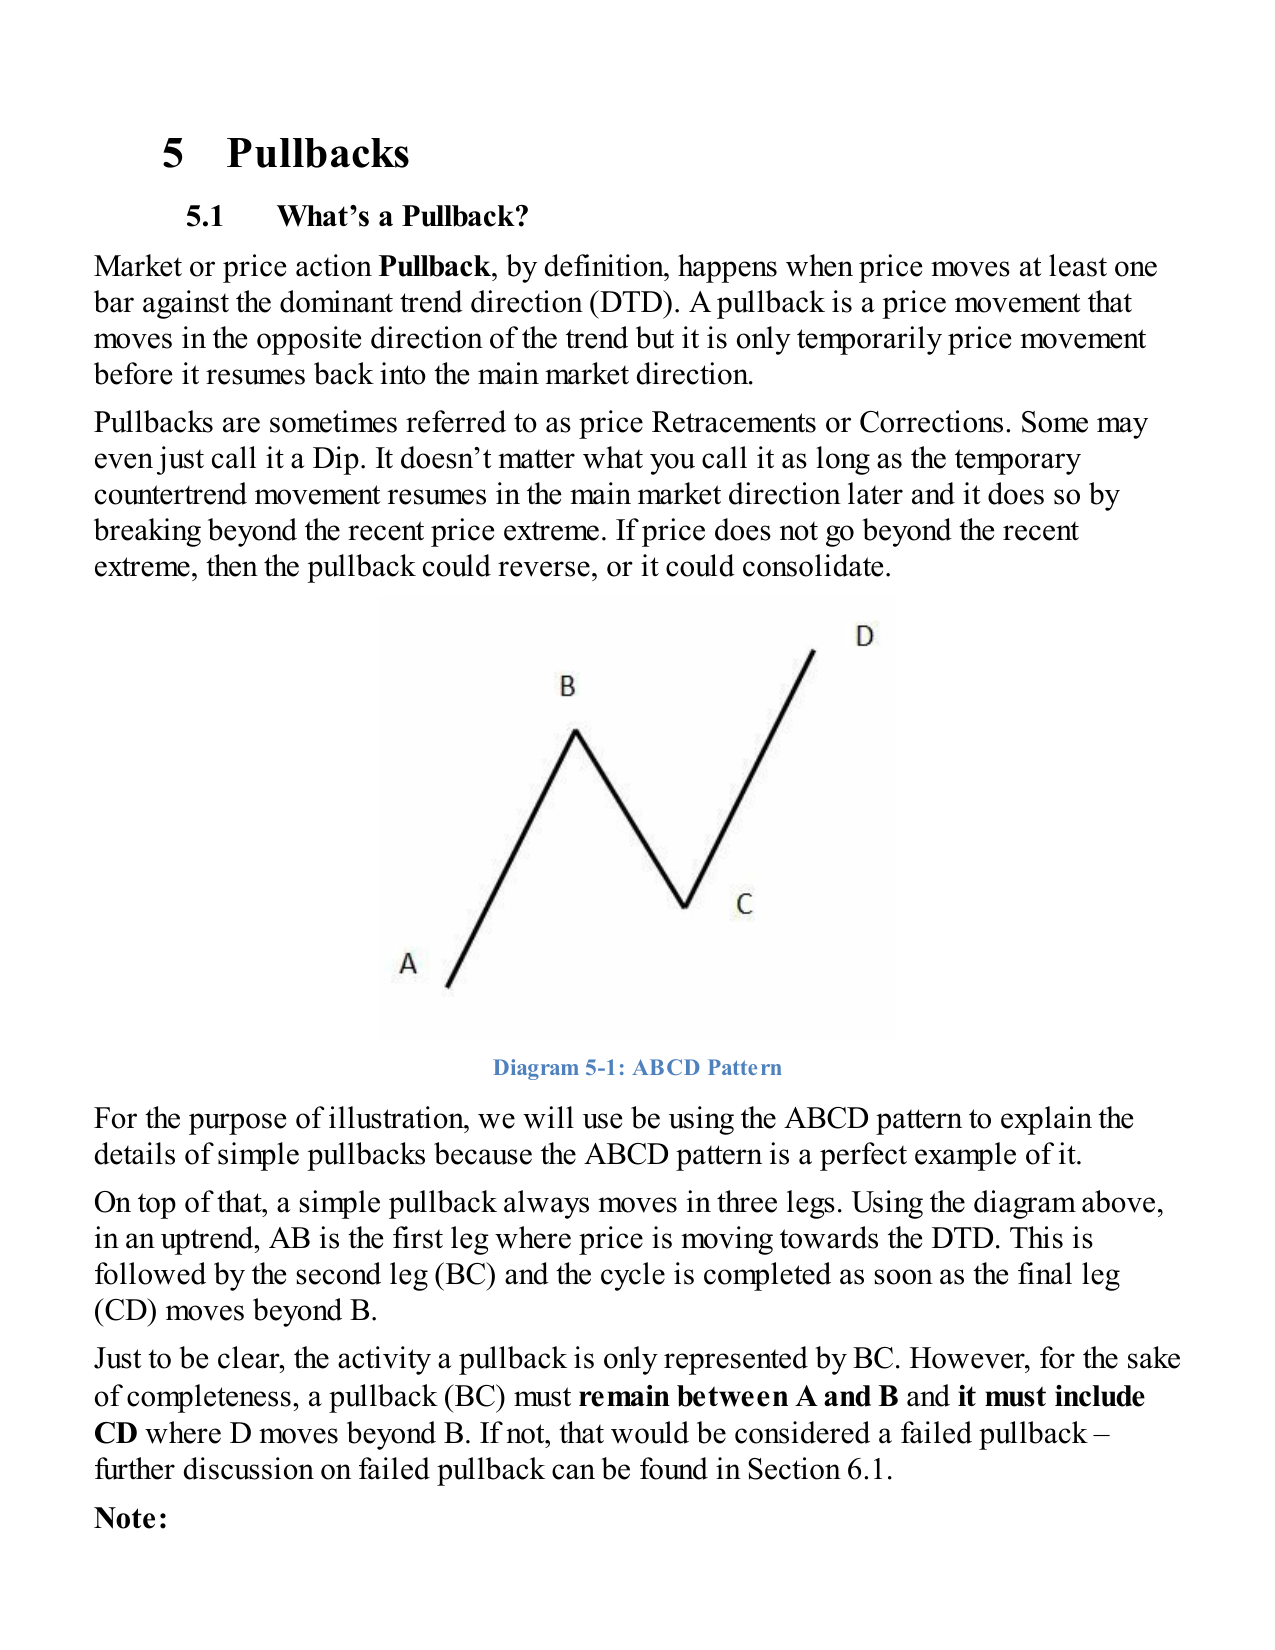
ABCD Pattern (p.23): AB = trend leg · BC = pullback (counter-trend) · CD = resumption beyond B. The pullback is only complete when D moves beyond B.
Core rule: do not buy the fall. Buy the turn after the fall, with a clear invalidation point.
1. The Pullback Decision Tree
Buy
Trend is strong, pullback is controlled, support holds, buyers reappear, and the stop is close enough for a sensible reward:risk.
Wait
Price is in the right area, but there is no turn yet. Let the next candle or lower-timeframe structure prove demand.
Avoid
Price slices through support, sell volume expands, the 20 EMA fails decisively, or the stock is already too extended.
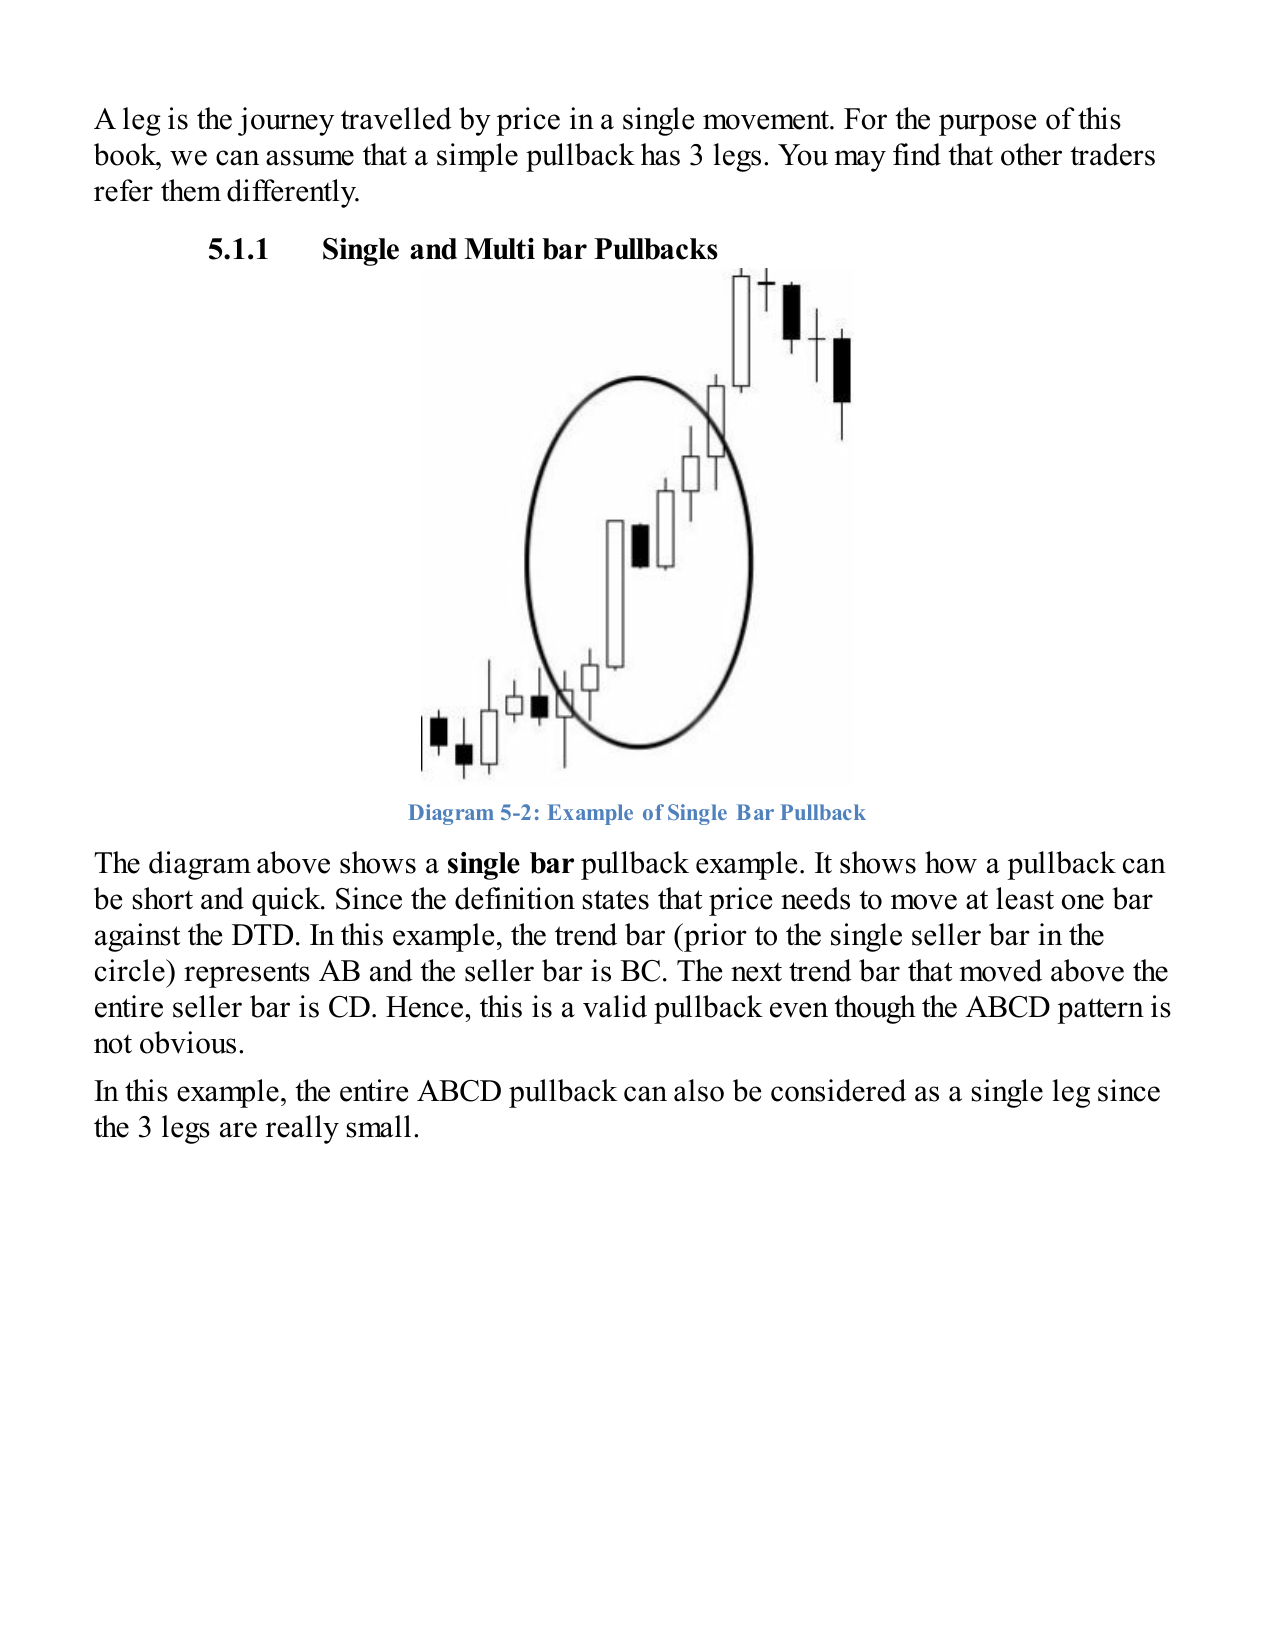
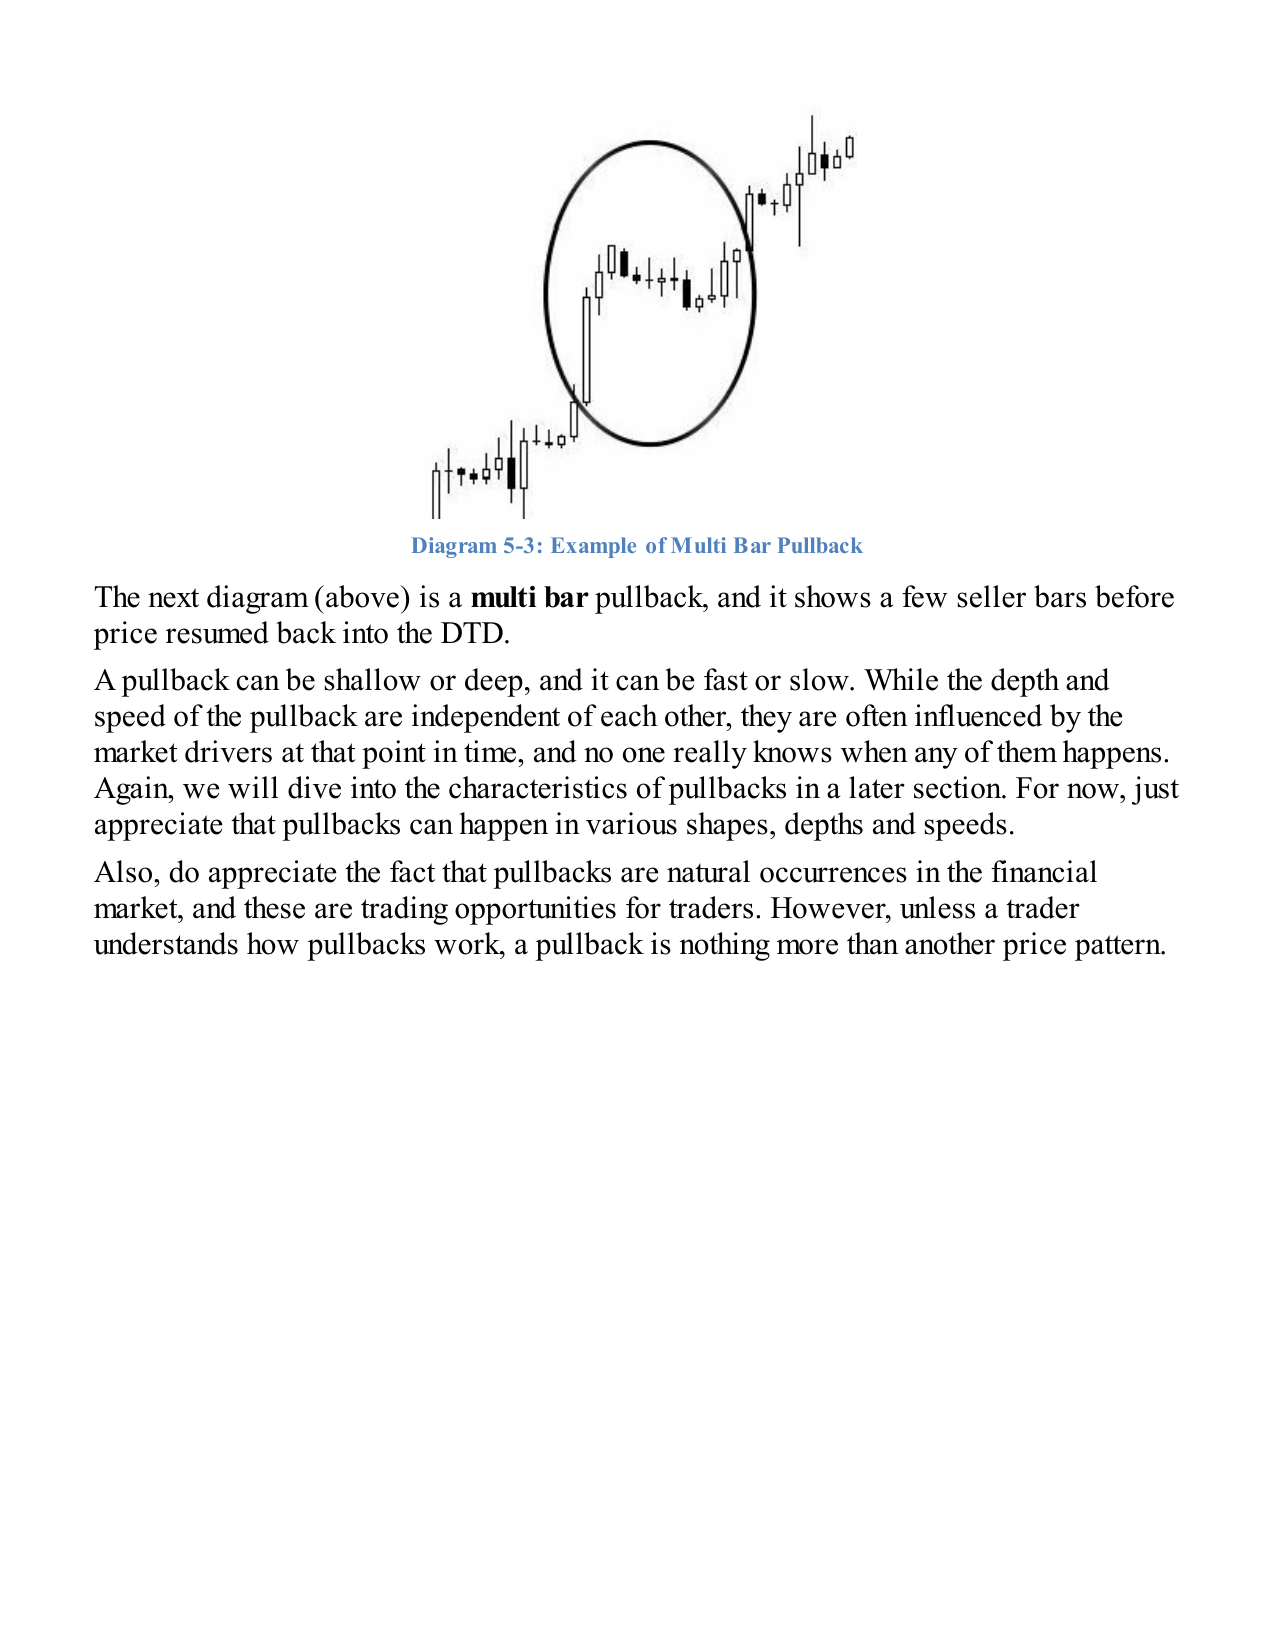
Single-Bar Pullback (p.24): The sharpest, fastest form — one bar against the DTD before continuation. Hardest to catch; highest conviction.Multi-Bar Pullback (p.25): Multiple candles forming BC. More time to identify and plan the entry. The most commonly traded form.
2. What Must Be True Before Buying?
A. Strong stock first
Price is above the 50 SMA and preferably above the 200 SMA.
The 10 EMA and 20 EMA are rising or beginning to curl upward.
There has already been a strong impulse move, breakout, gap, earnings reaction, or clear relative strength.
The stock or coin is not merely falling in a larger downtrend.
B. Controlled weakness
Pullback candles are smaller than the impulse candles.
Volume cools compared with the original breakout or launch.
Price is pulling into a logical area: 10 EMA, 20 EMA, VWAP, or prior breakout support.
The move does not look like panic selling or a clean breakdown.
C. Buyers reappear
Break above the previous candle high.
Reclaim of the 10 EMA or 20 EMA.
Higher low on the lower timeframe.
Break of a small descending pullback trendline.
Green candle with improving volume after testing support.
D. Invalidation is obvious
Below the pullback low.
Below the 20 EMA if that is the level being used.
Below VWAP for intraday VWAP setups.
Below the failed breakout retest level.
If the stop is too far away, the entry is probably too late.
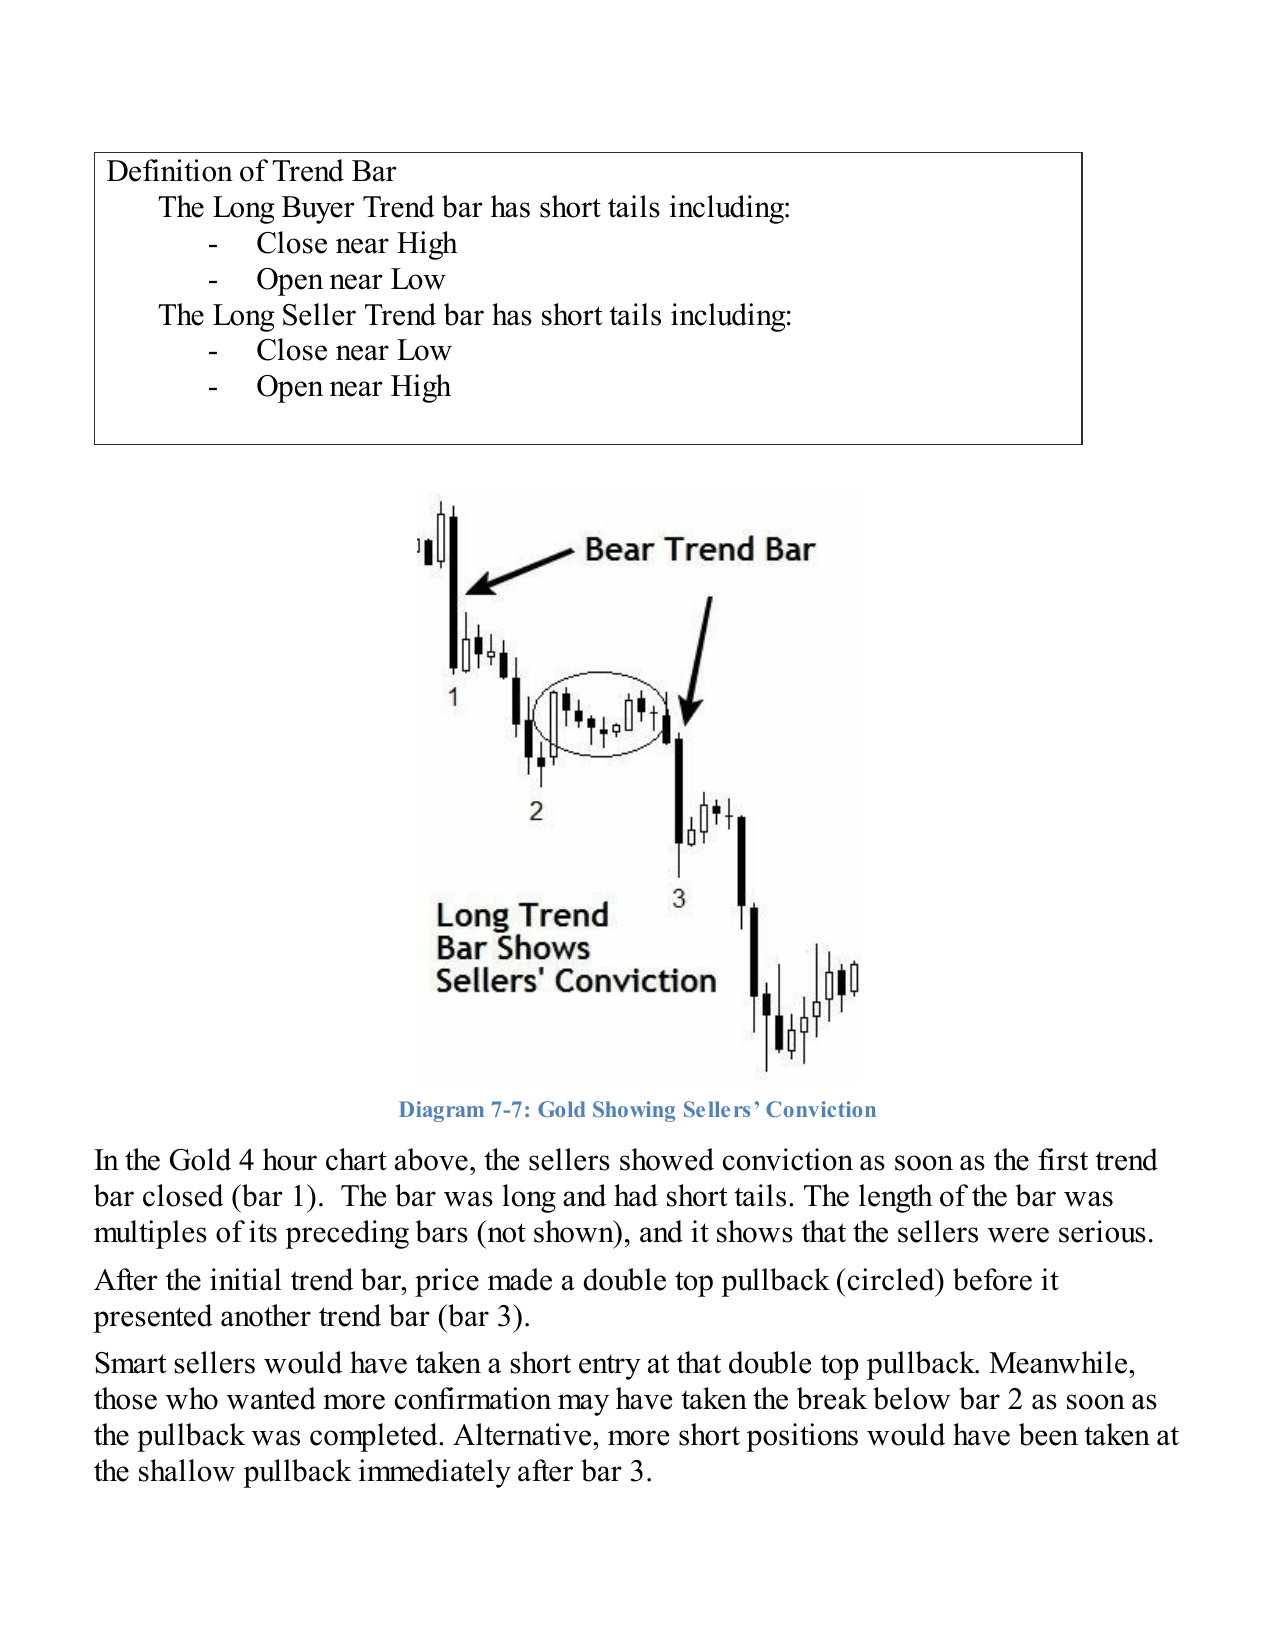
Buyers' Conviction Bar (p.69): The candle structure confirming institutional re-entry. Long body, close near the high, minimal upper tail — this is the D-bar signature to look for at pullback terminals.Sellers' Conviction Bar (p.68): The opposite signature — strong, body-dominated red candle closing near its low. When this appears in BC, it signals too much selling pressure. Avoid entries until this resolves.
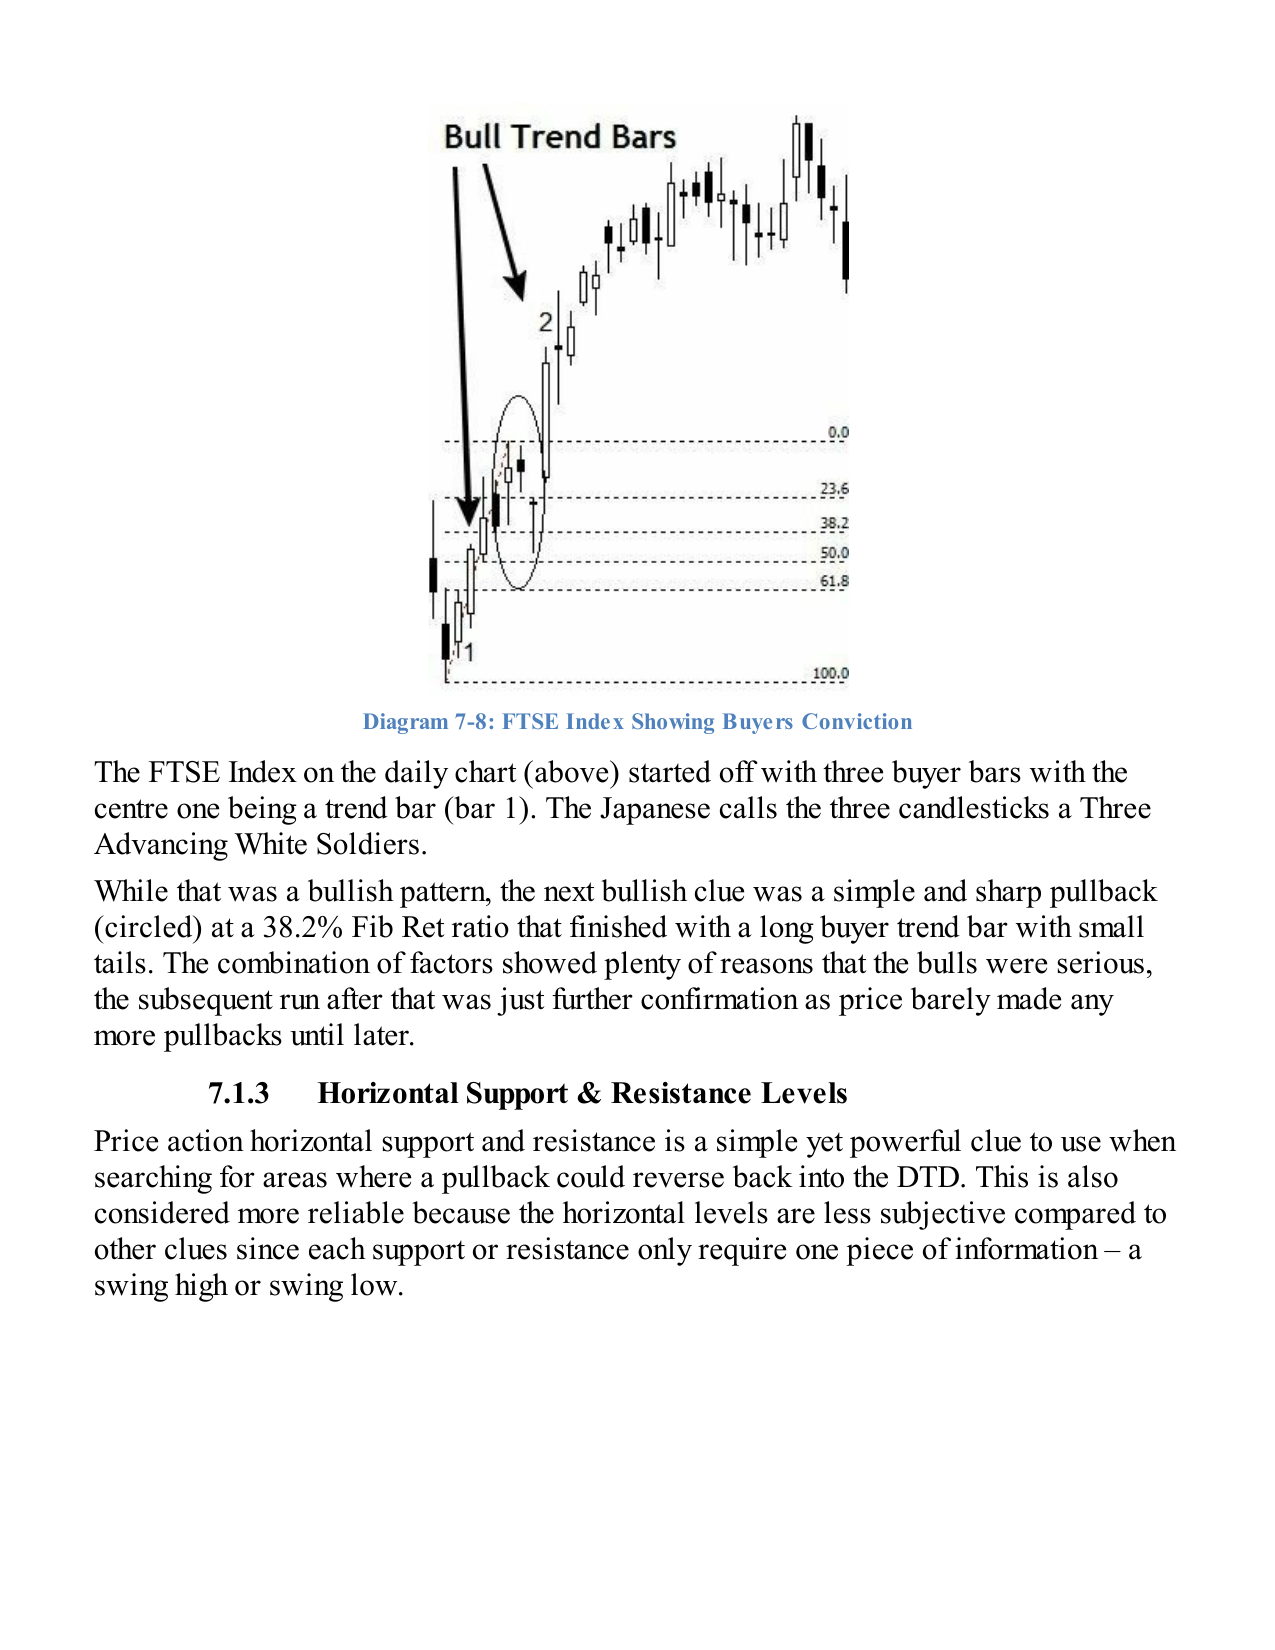
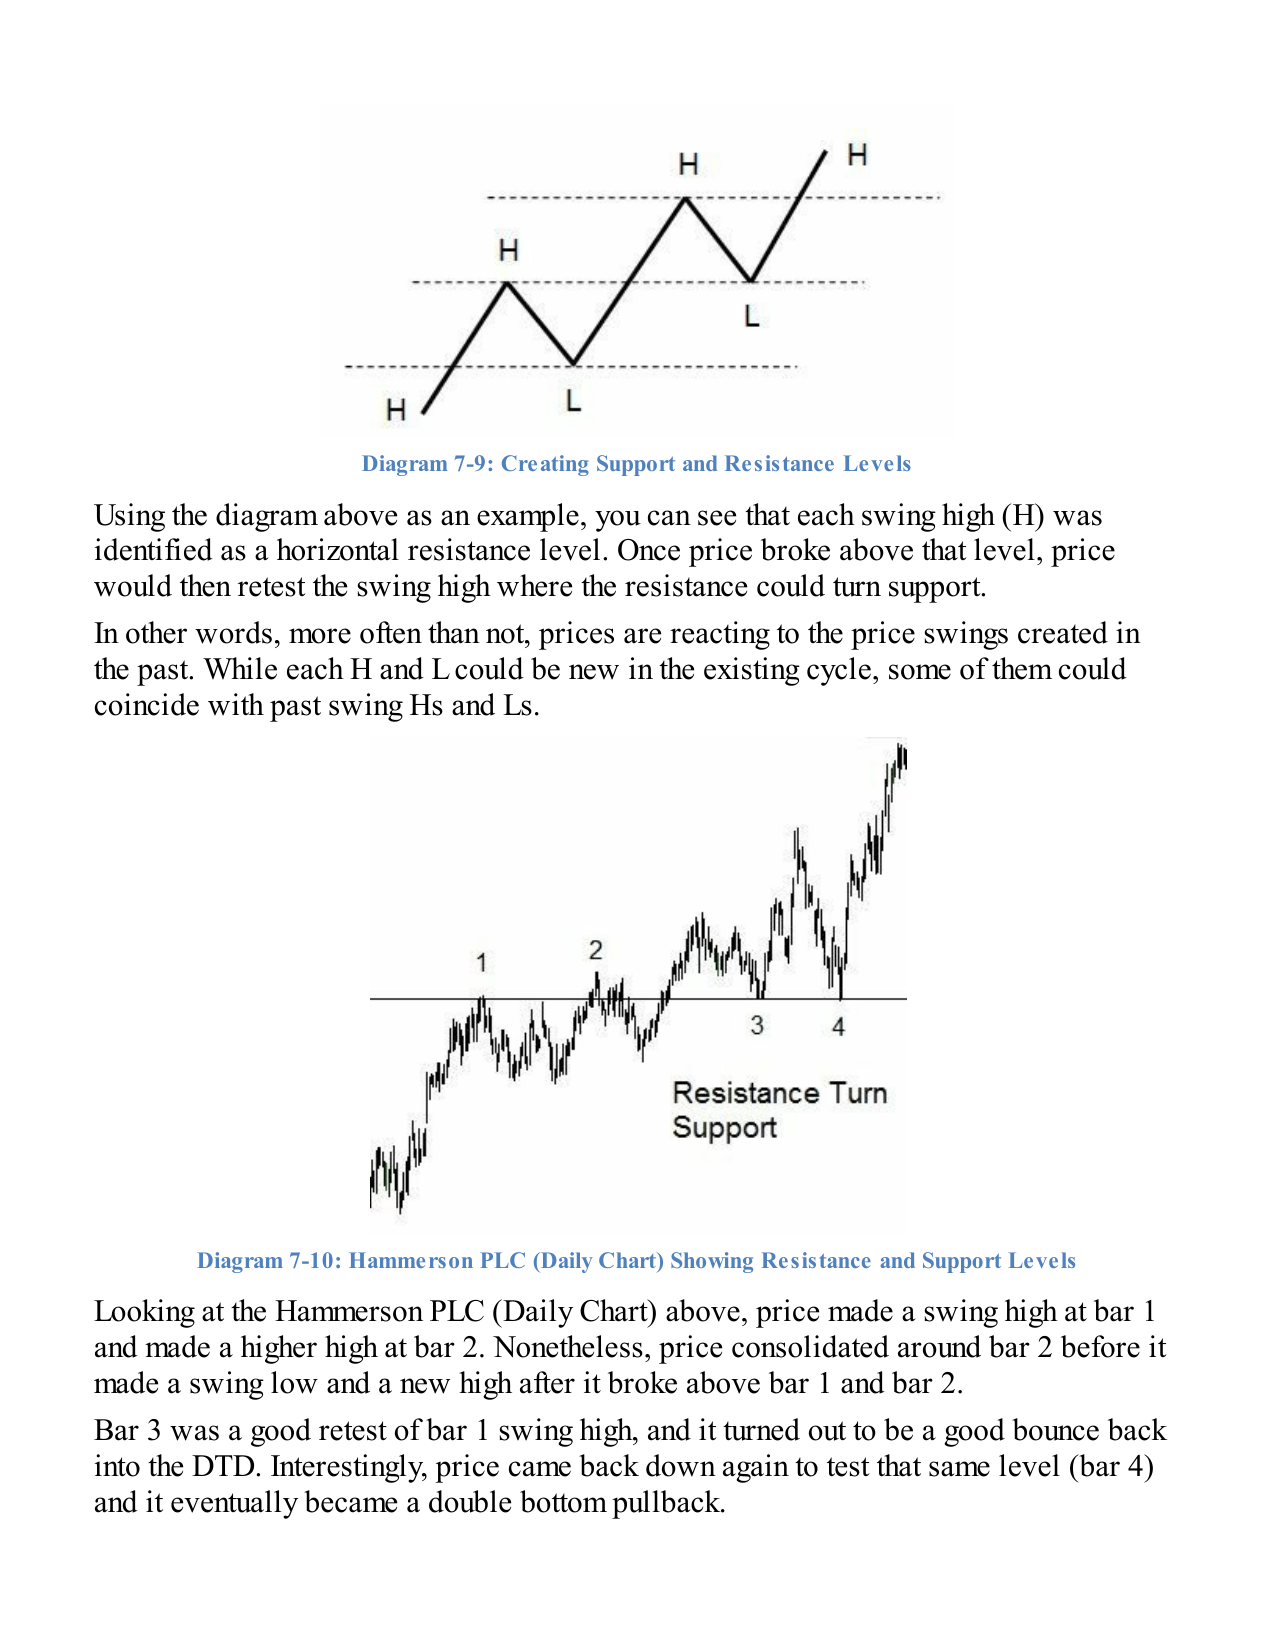
Support & Resistance as Pullback Zones (p.70): Old resistance becomes support after a breakout. A pullback (BC) that terminates at a prior swing high — now acting as support — dramatically increases entry probability. Require at least two prior touches to validate the level.
3. The Practical Rule
The simplified rule is:
Buy only when a strong stock pulls back into the 10/20 EMA or breakout-support area and then turns back up. If it loses the 20 EMA, the pullback low, or the breakout level on heavy volume, the setup is invalidated.
This matters because the moving average is not the buy signal. It is only the place to pay attention. The actual entry comes when the chart gives evidence that the pullback is ending.
Simple Pullback Types
Understanding which type of pullback is forming changes both the expected continuation distance and the Fibonacci zone to watch.
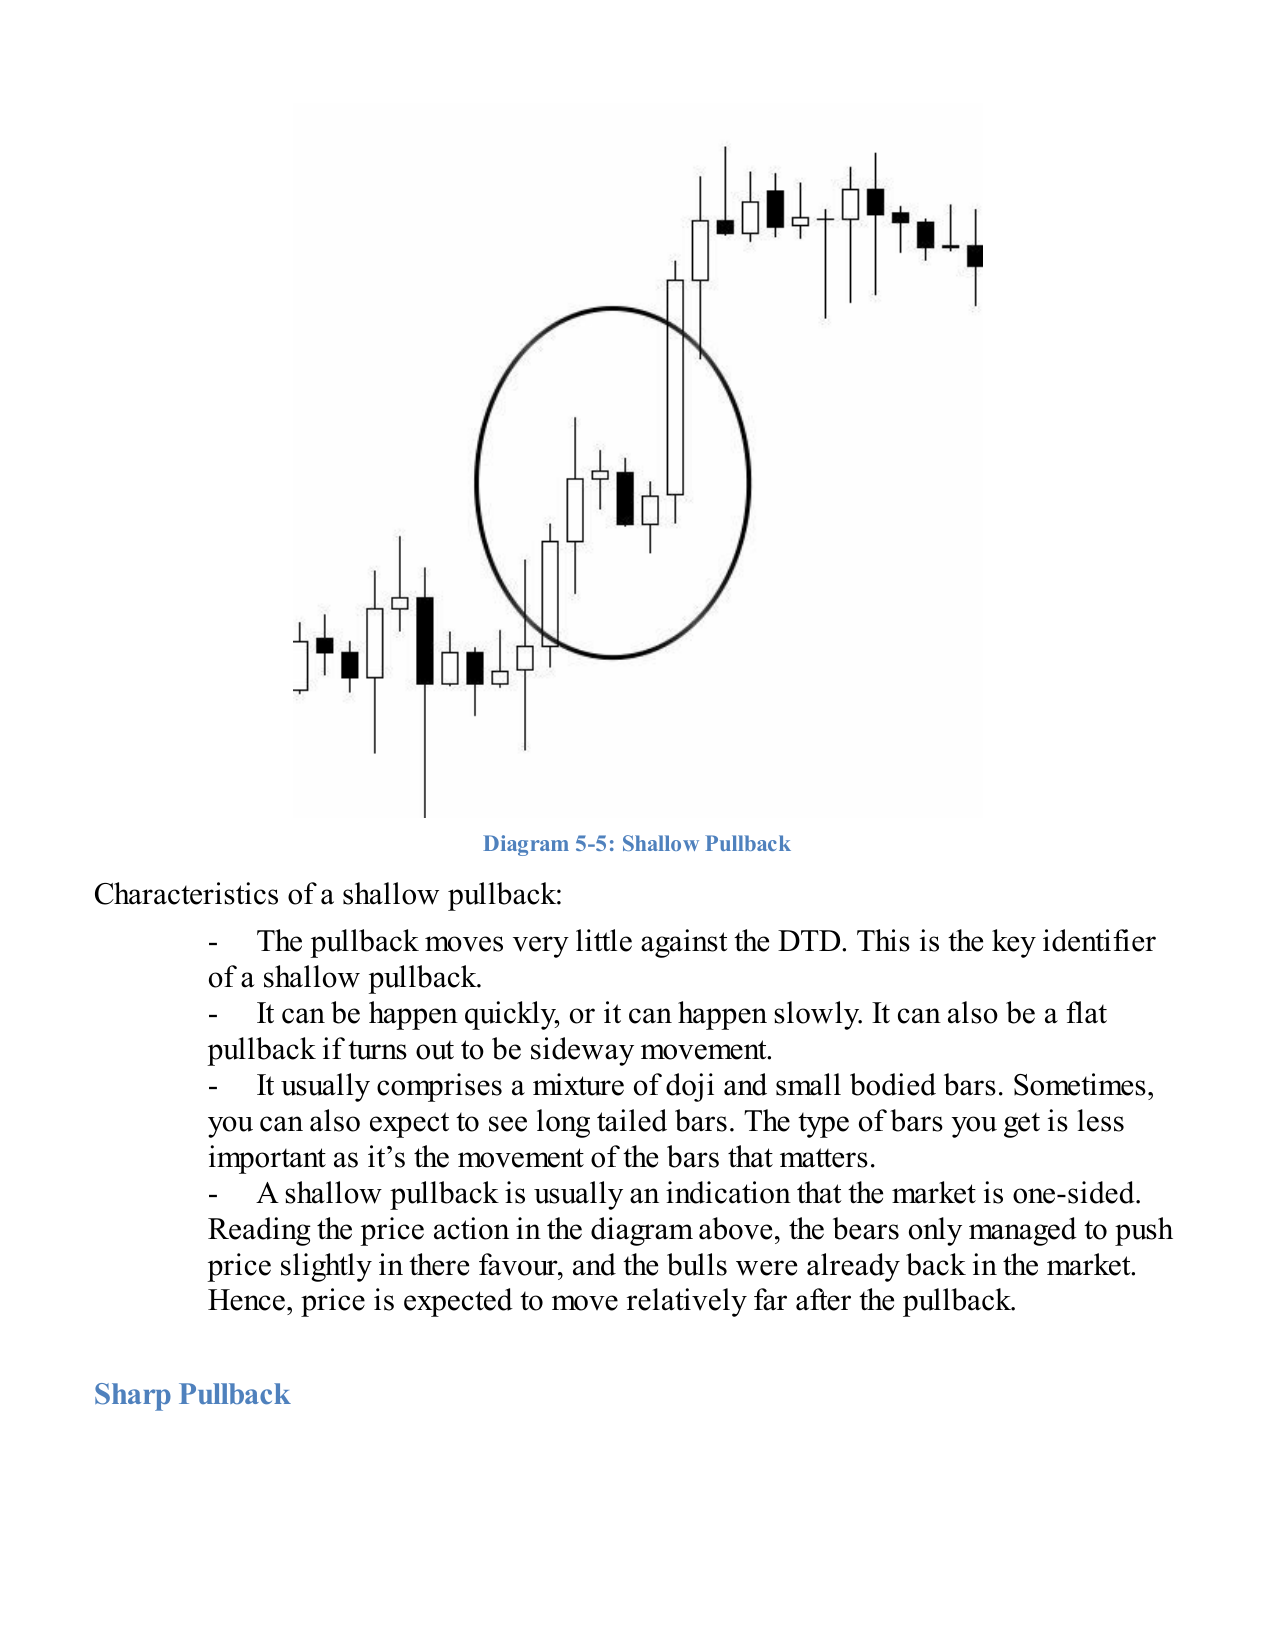
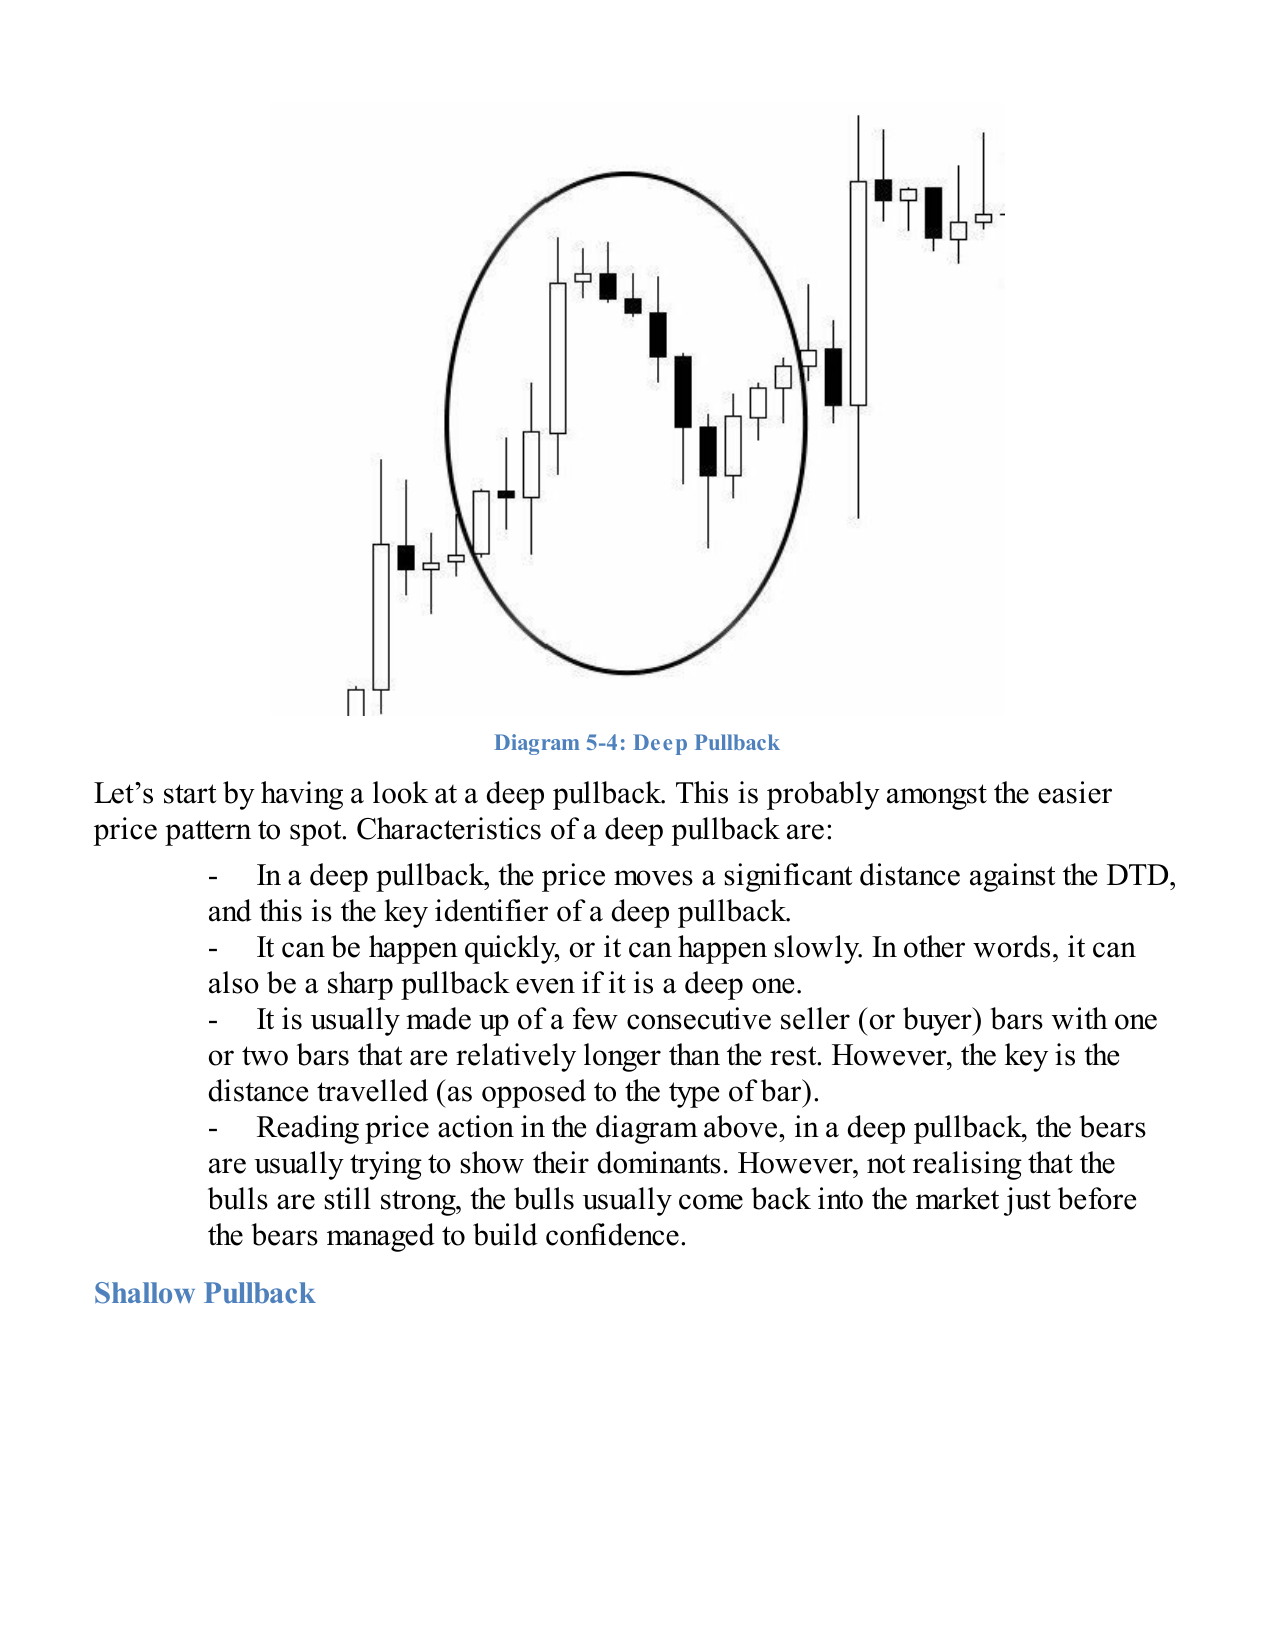
Shallow Pullback (p.28): 23.6–38.2% retracement. Signals a one-sided, dominant trend. Expect a large, sustained continuation move after entry. The most profitable setup when the trend is genuinely strong.Deep Pullback (p.27): 61.8–76.4% retracement. Can indicate waning momentum. The continuation move, if it occurs, is often weaker than after a shallow pullback. Size accordingly.
Complex Pullback Patterns — Stand Aside
Complex pullbacks consolidate before resolving. They are harder to trade and frequently morph into reversals. The default approach is to wait for a clean simple pullback to re-emerge.
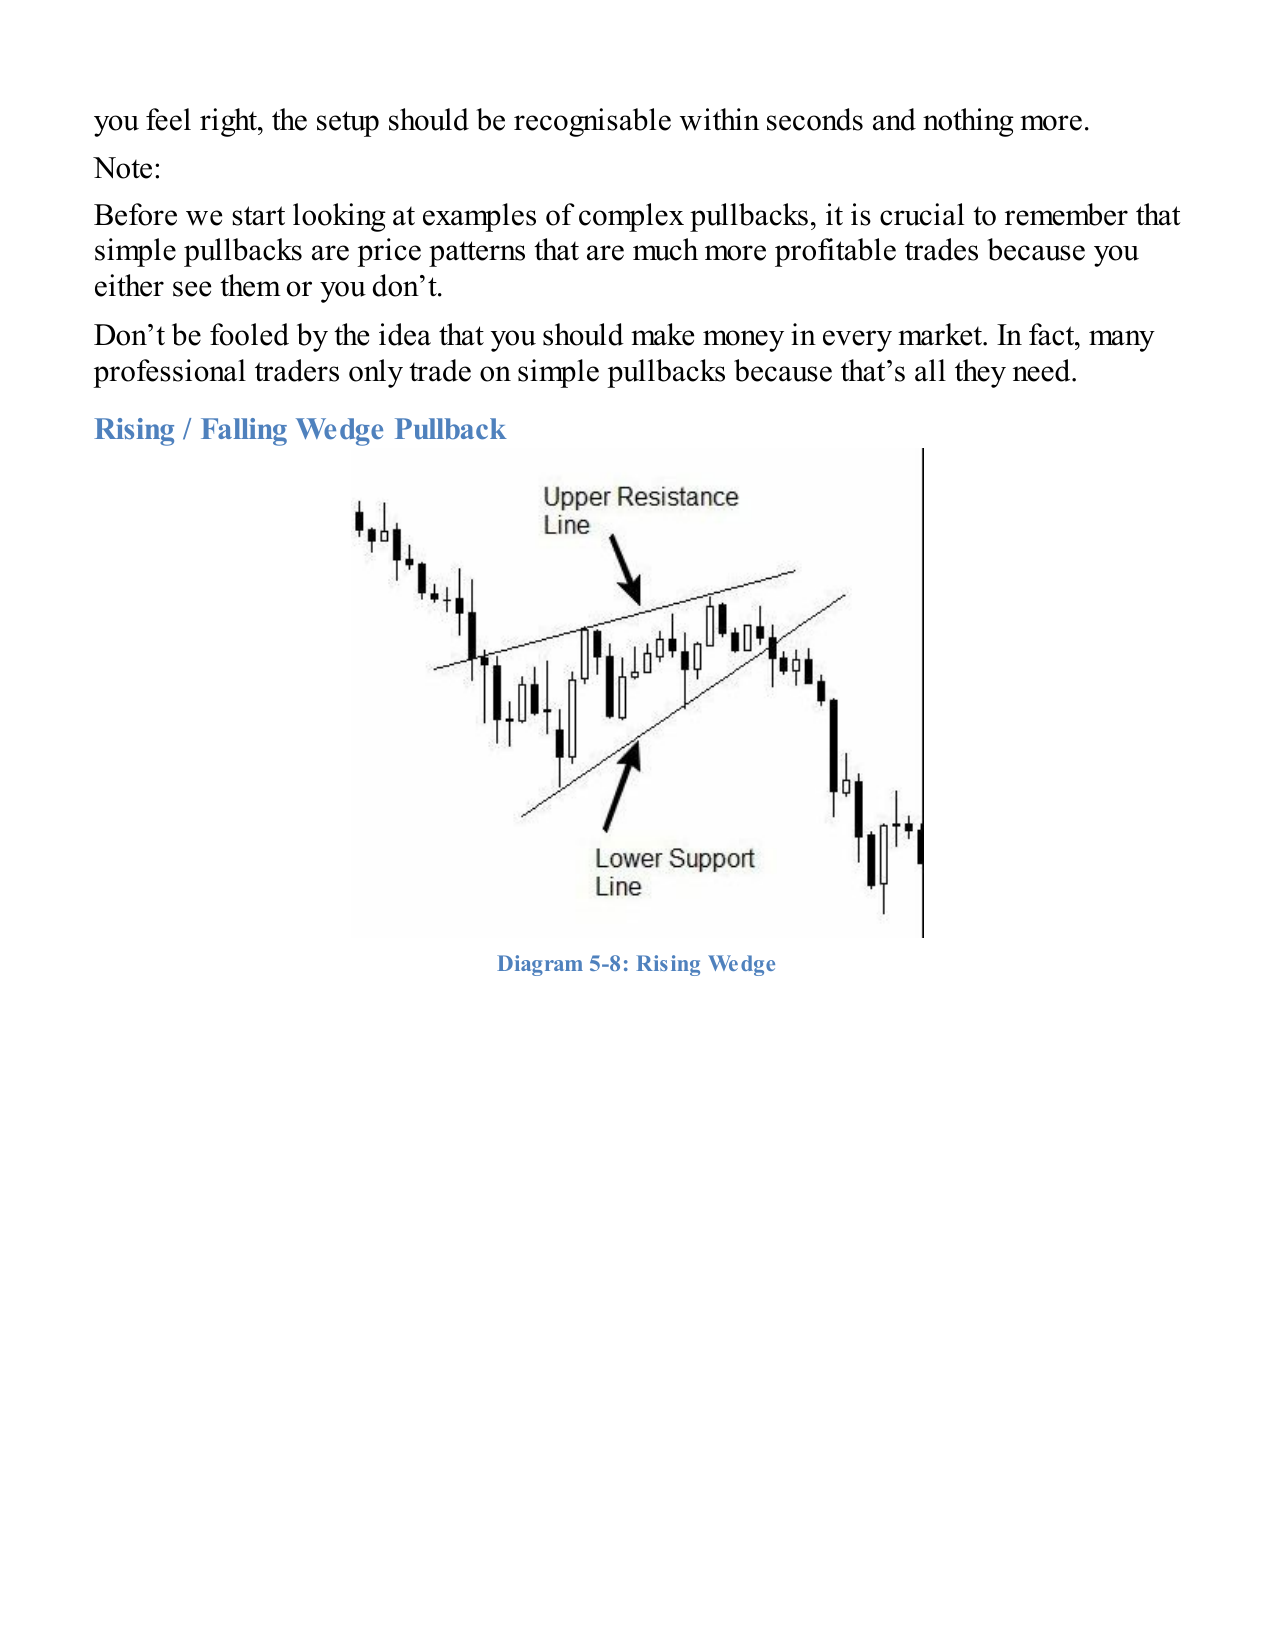
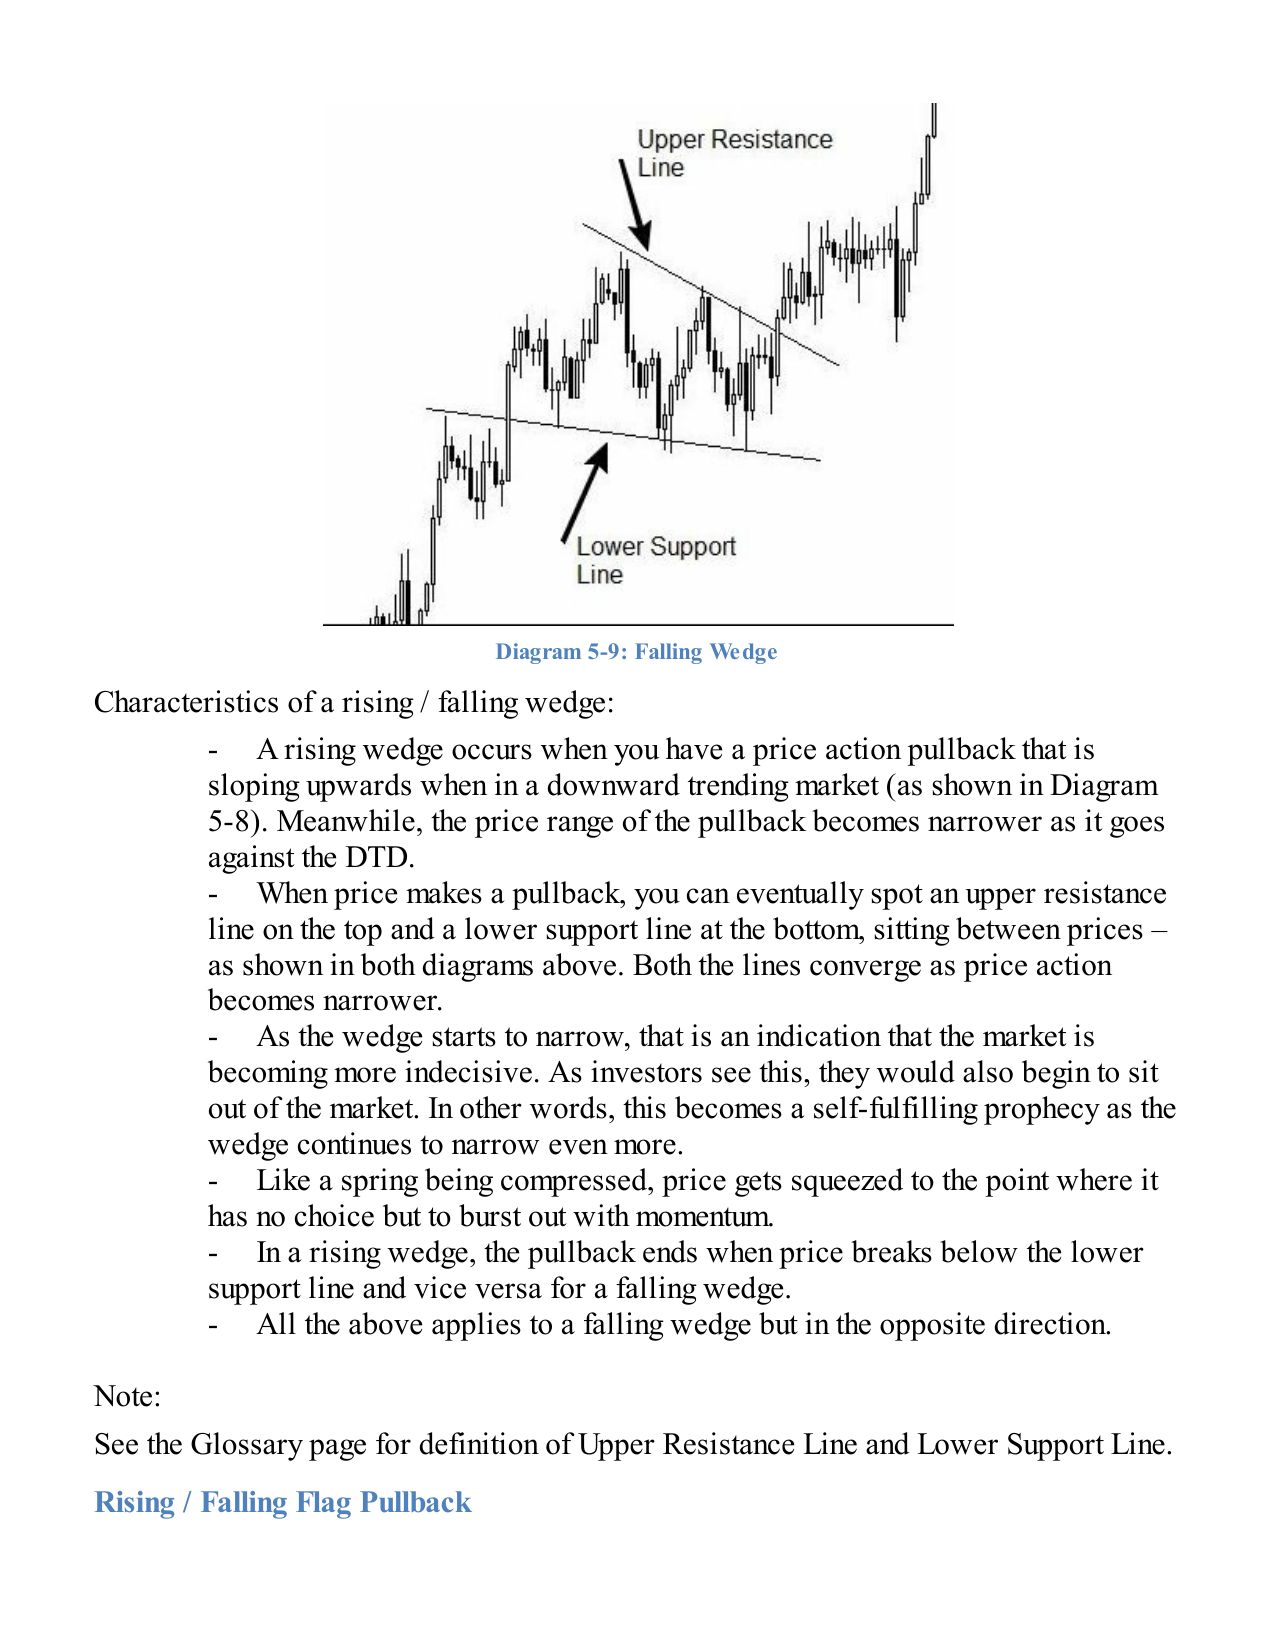
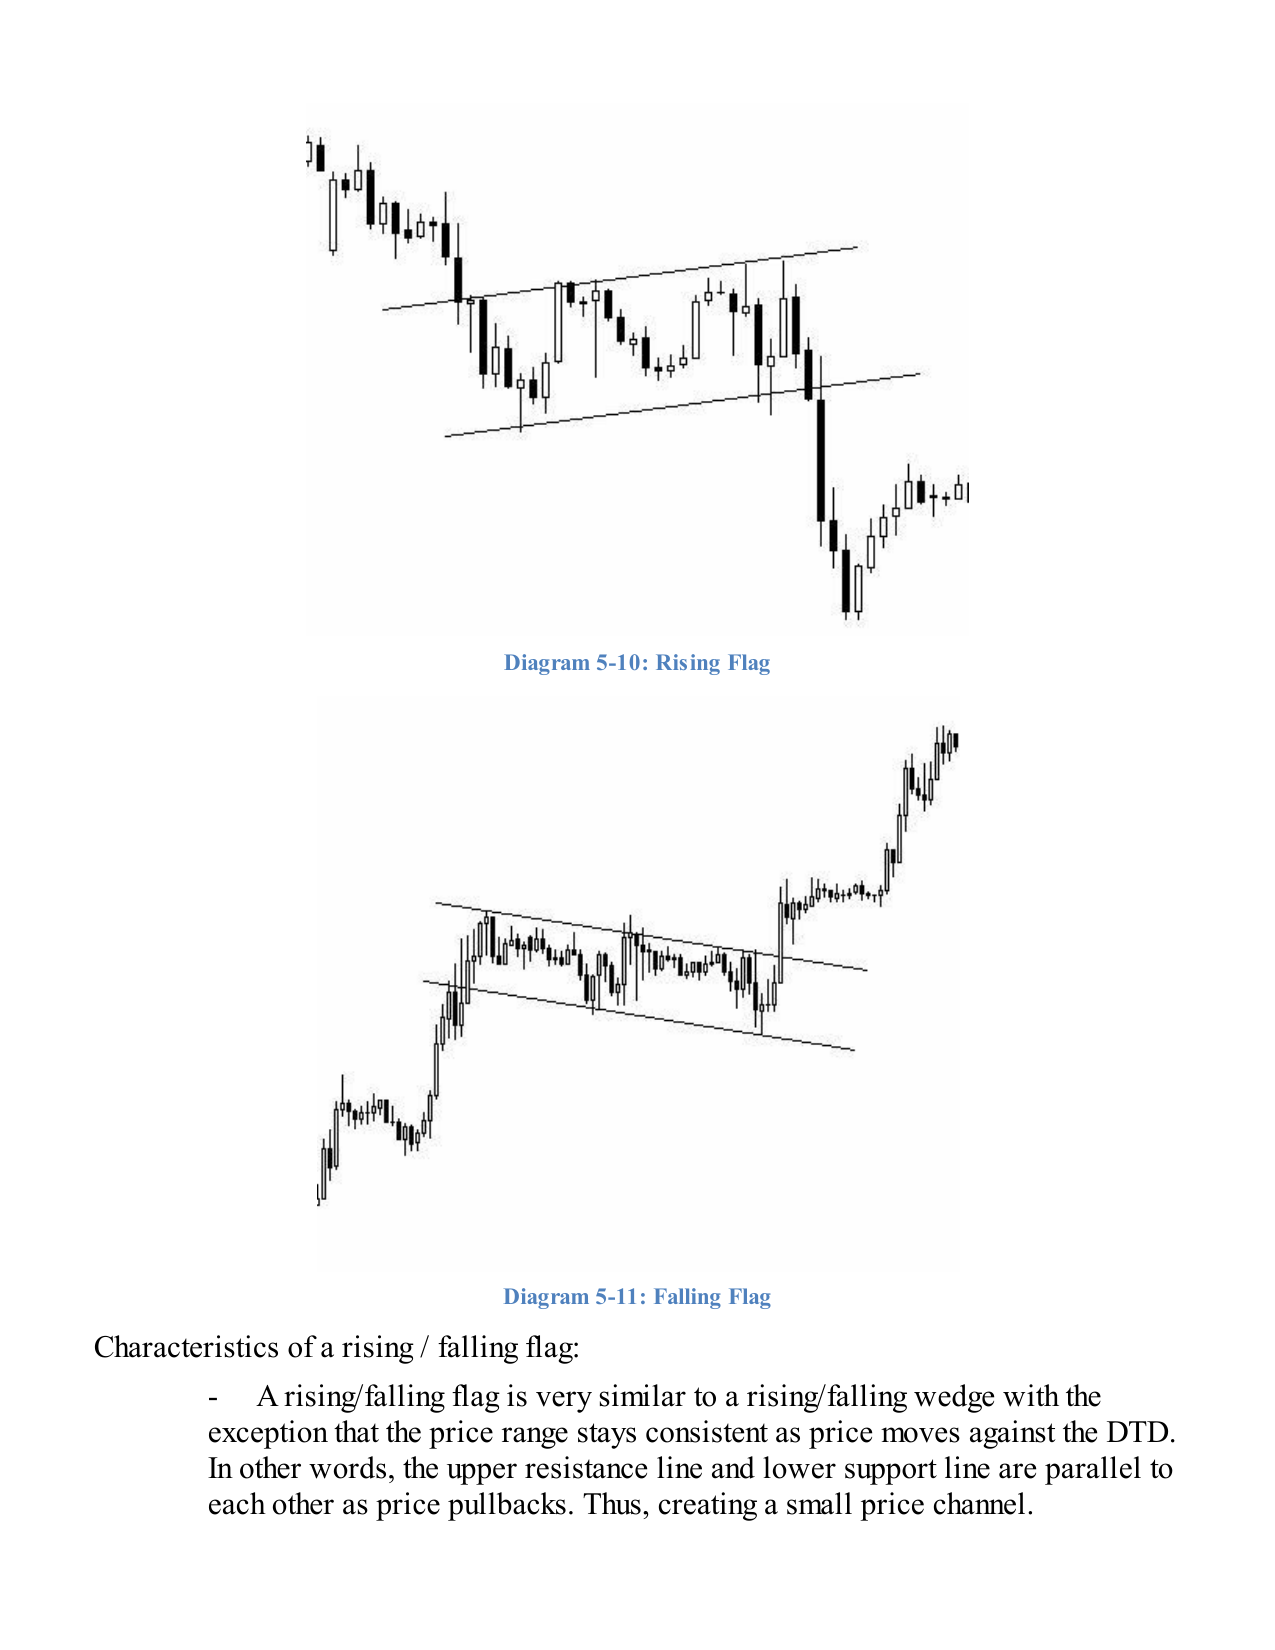
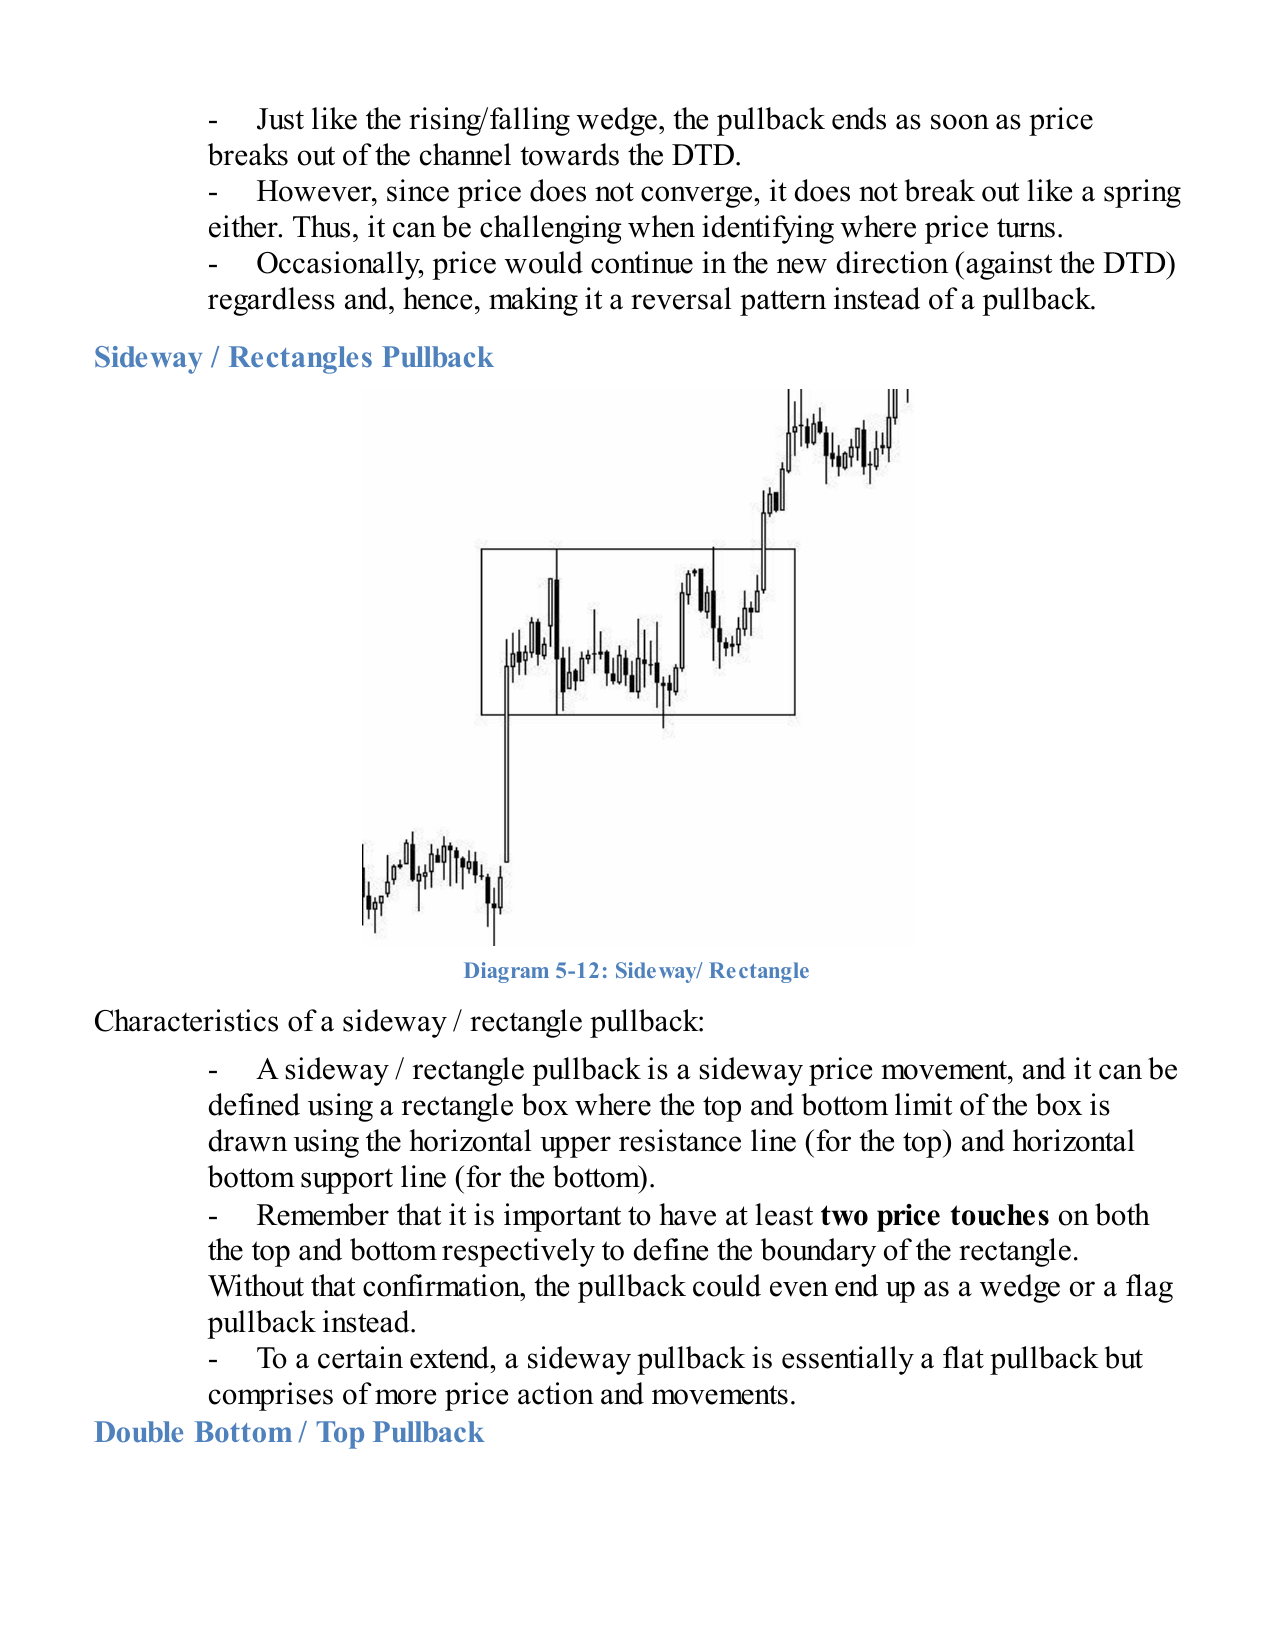
Rising Wedge (p.31): Converging lines sloping against the DTD in a downtrend. Wait for a break of lower support before re-entering short.Falling Wedge (p.32): Converging lines in an uptrend. Break of upper resistance signals pullback completion and resumption. Attractive but timing is uncertain.Flags (p.33): Parallel channel sloping against the DTD. A break out of the channel in the trend direction signals resumption — but the same channel can become a reversal pattern.Rectangle / Sideways (p.34): Horizontal consolidation with two or more touches top and bottom. Treat as a flat pullback on a larger scale. Wait for the DTD breakout before entry.
4. Pullback Examples
LABUSDT 1D — Clean Pullback + Reclaim
Best example
This is the cleanest teaching example: strong existing trend, rising moving averages, a pullback into the 10/20 EMA area, and then a sharp turn back up.
Buy zoneApprox. 0.64–0.73
TriggerReclaim / break above small base
InvalidationBelow 0.58794
First targetRetest near 0.97
Lesson: this is the model setup. The better entry is the turn from the EMA zone, not the large candle after the move is already obvious.
UBUSDT 1D — Pullback Watch
Wait for turn
This is a useful watchlist example. The prior move is strong and volume has cooled, but the screenshot shows price still in the pullback phase rather than clearly turning.
Buy zoneApprox. 0.10–0.11
TriggerBreak above prior candle high
InvalidationLoss of 0.09 / 20 EMA area
Target0.15, then 0.18
Lesson: this is where patience matters. The setup is interesting, but the buy only appears if buyers step back in.
PN 30m — Intraday Pullback
Possible
PN shows a strong intraday move followed by a pullback into the 10/20 EMA area. It is workable, but messier than the clean daily examples and needs a tighter trigger.
Buy zoneApprox. 5.35–4.85
TriggerReclaim 5.60–5.80
InvalidationLoss of 4.85 / hard under 4.39
Target6.00–6.40, then 6.76
Lesson: intraday pullbacks need discipline. A touch of the EMA is not enough; wait for price to stop making lower candles.
AUUD 15m/5m — Messier Reclaim
Choppy
AUUD is a useful example of a choppier intraday pullback. It has a prior move, a consolidation/reclaim attempt, and a possible base, but the structure is less clean.
Buy zoneApprox. 6.85–7.05
TriggerHold/reclaim 7.10–7.40
InvalidationBelow 6.71 / hard under 6.41
Target7.75, then 8.60–9.40
Lesson: this is not wrong, but it is lower quality. Size smaller or wait for a cleaner reclaim.
When Pullbacks Fail
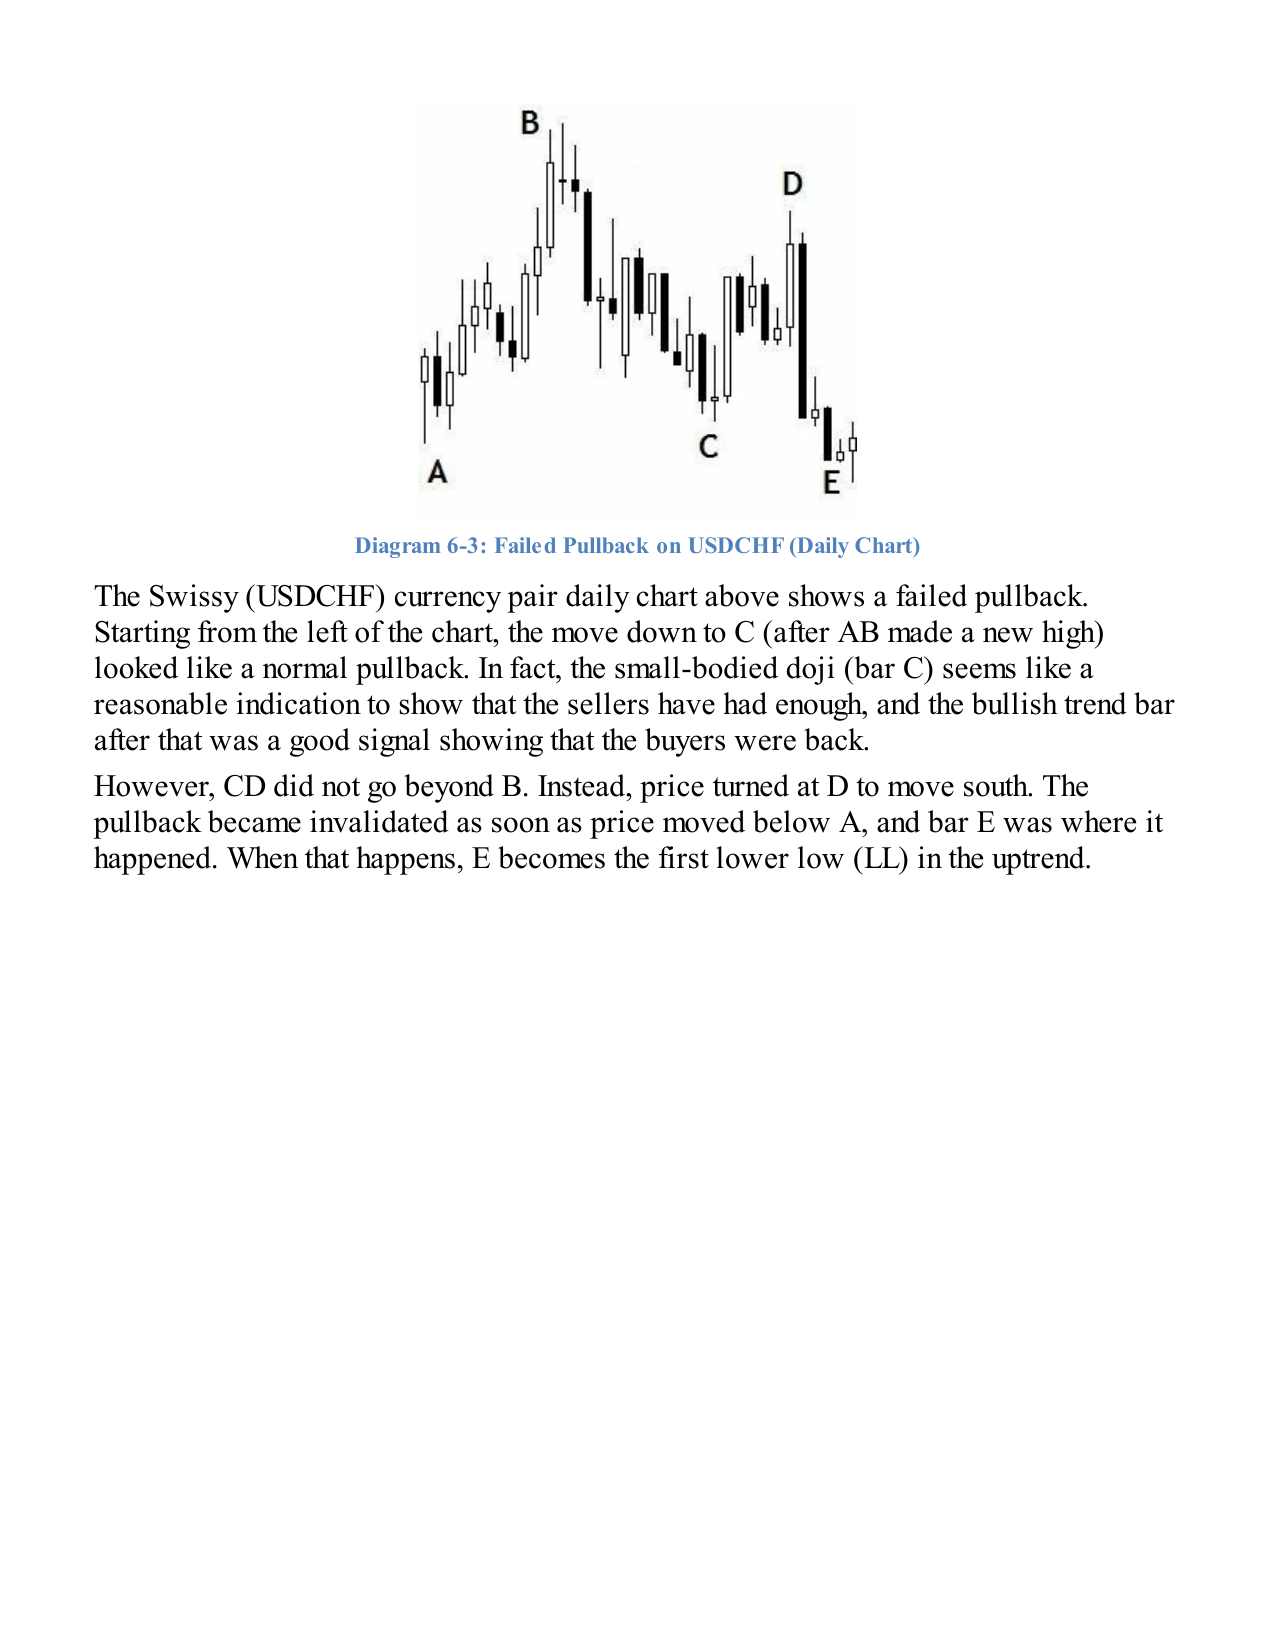
A pullback fails when C breaks clearly beyond A — price does not resume the trend but instead breaks the prior structural extreme. This is critical market information, not just a losing trade.
Failed Pullback — USDCHF (p.49): A real-market example showing C breaking convincingly below A. Note: it is a candle close beyond A that signals conviction — wicks alone are stop hunts, not failures.
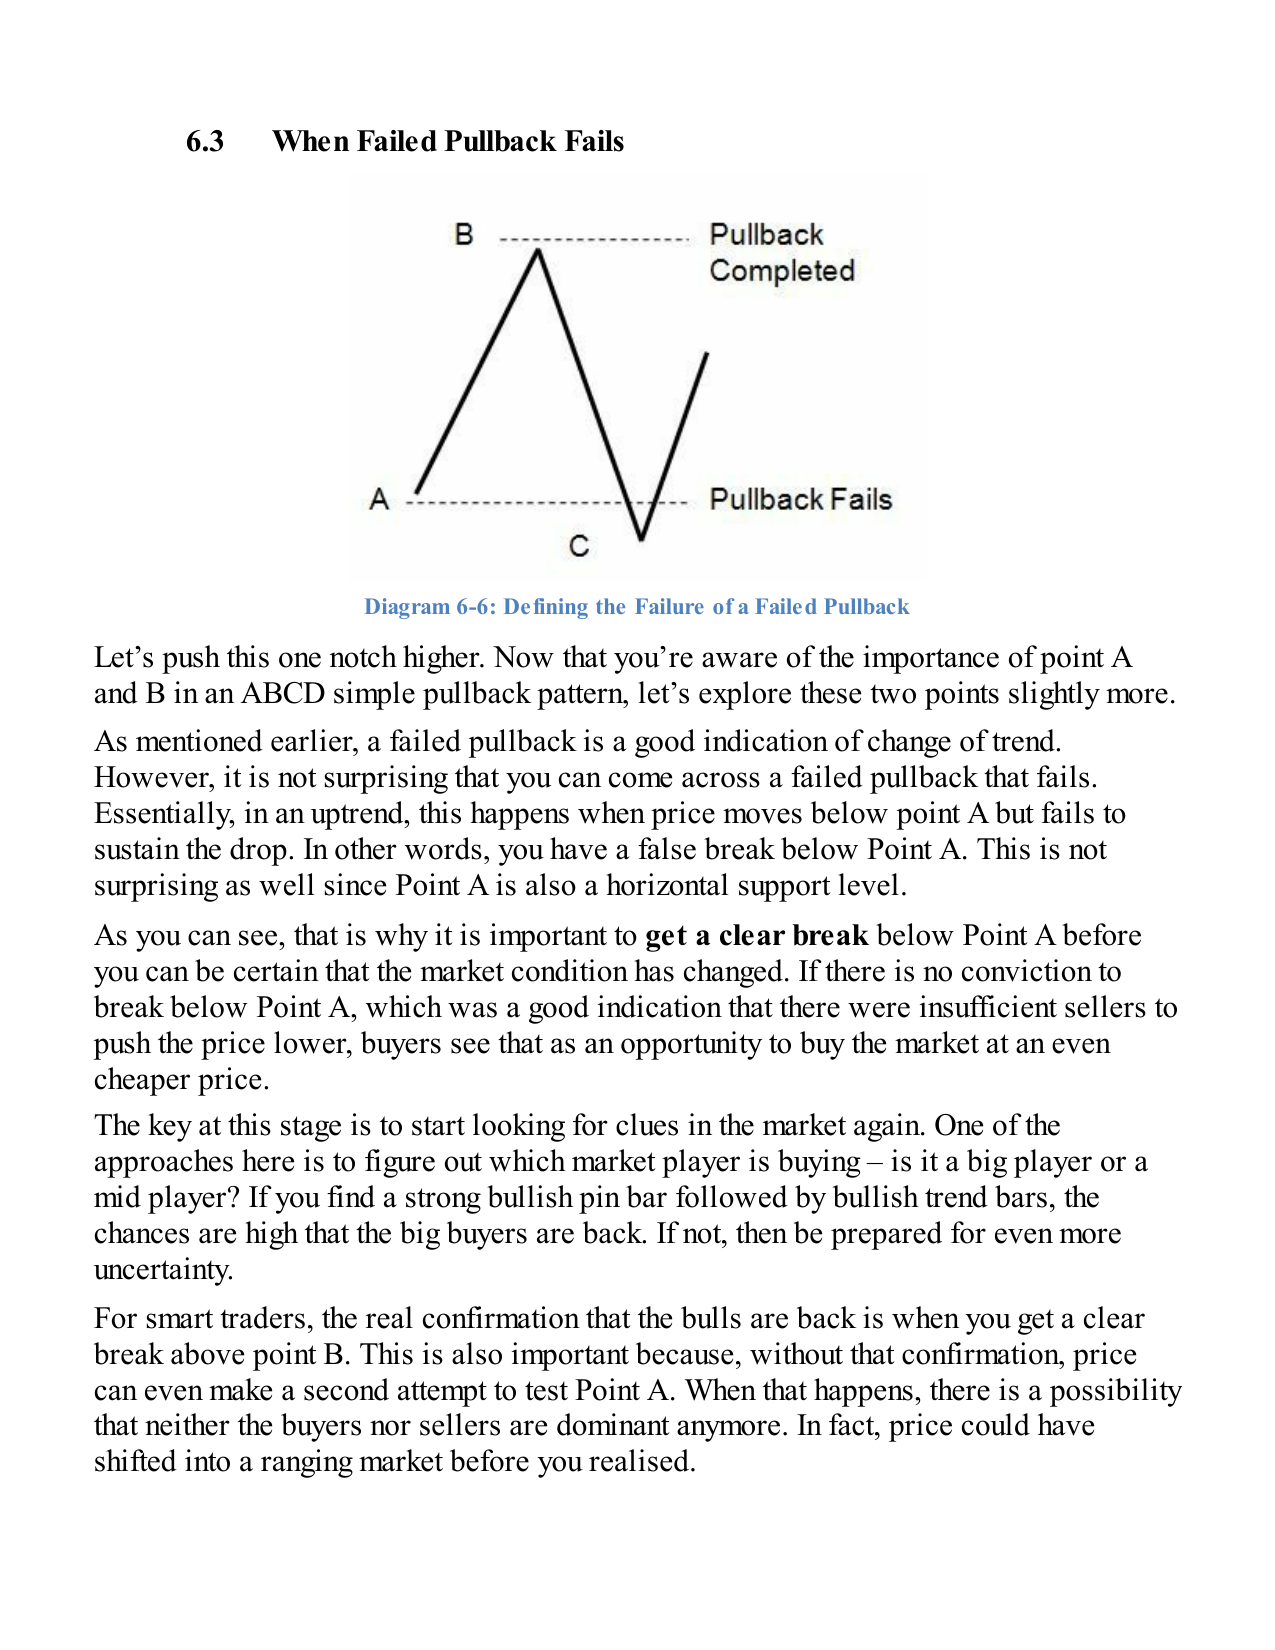
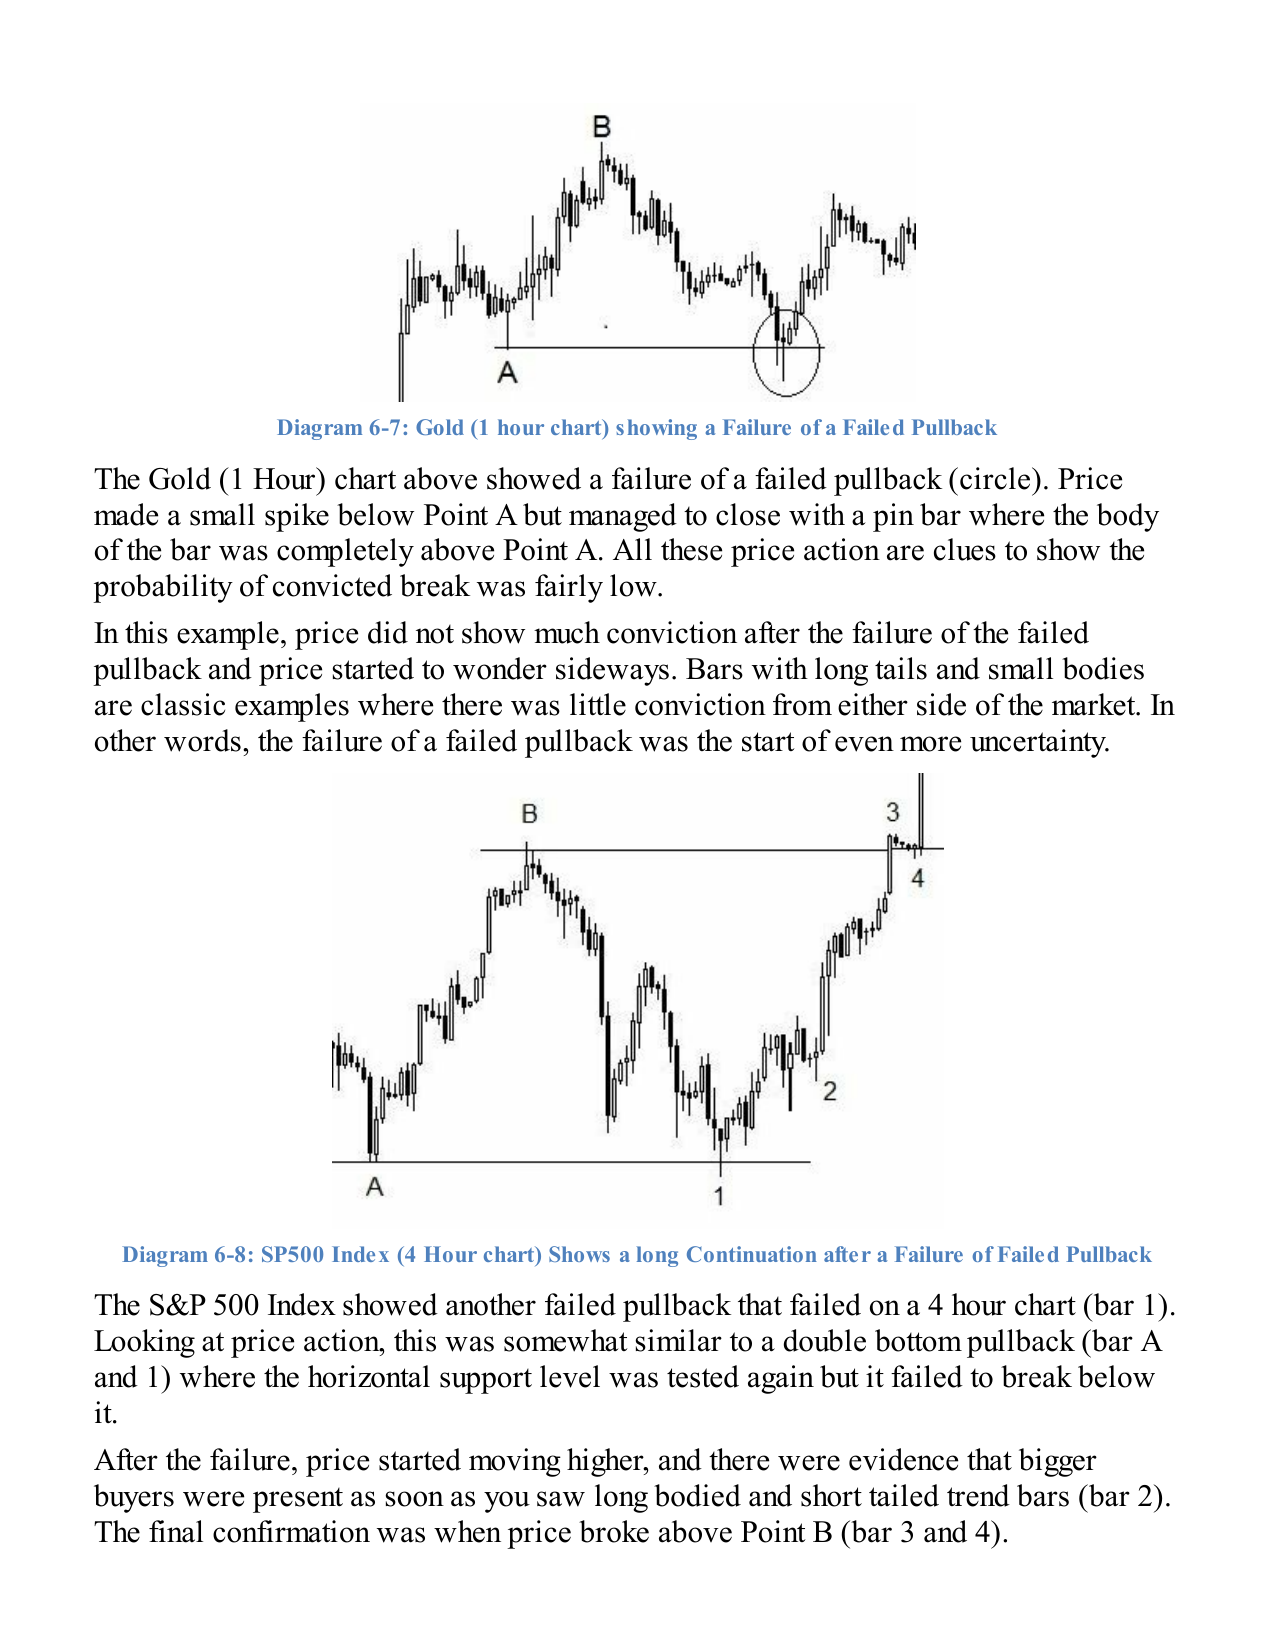
Failed Failed Pullback — Definition (p.52): A wick below A that closes back above it is not a failure — it is a stop hunt. This pattern (often a bullish pin bar) signals insufficient sellers and is a powerful long entry in disguise.Failed Failed Pullback — Examples (p.53): Real-market instances of the pattern. In each case, the false break below A flushes out weak longs before the genuine D-leg continuation fires.
5. What Is Not a Pullback Entry?
Chart Type
What It Looks Like
Correct Response
Vertical extension
Price is far above the 10/20 EMA, RSI is stretched, and candles are already large.
Do not chase. Wait for the next pullback, base, or flag.
Still falling
Price is entering the EMA zone, but there is no higher low, reclaim, or buyer reaction.
Watch only. The setup is not active until buyers reappear.
Heavy breakdown
Large red candles cut through the 20 EMA or breakout level on expanding sell volume.
Avoid. This is not controlled weakness.
Messy chop
Price keeps crossing moving averages with no clean trend or clear invalidation.
Pass or trade smaller only with an intraday trigger.
6. Buy Zone vs Buy Trigger
Buy Zone
The buy zone is where price is worth watching. It is not the entry by itself.
10 EMA / 20 EMA area.
Prior breakout level.
VWAP on intraday trades.
Previous resistance becoming support.
Rising trendline support.
Buy Trigger
The trigger is evidence that the pullback may be ending.
Break above previous candle high.
Reclaim of the 10 EMA or 20 EMA.
Higher low on the lower timeframe.
Break of a small descending trendline.
Green candle with improving volume.
Important distinction: the zone tells you where to watch. The trigger tells you when to act.
The First Pullback: Highest-Probability Entry
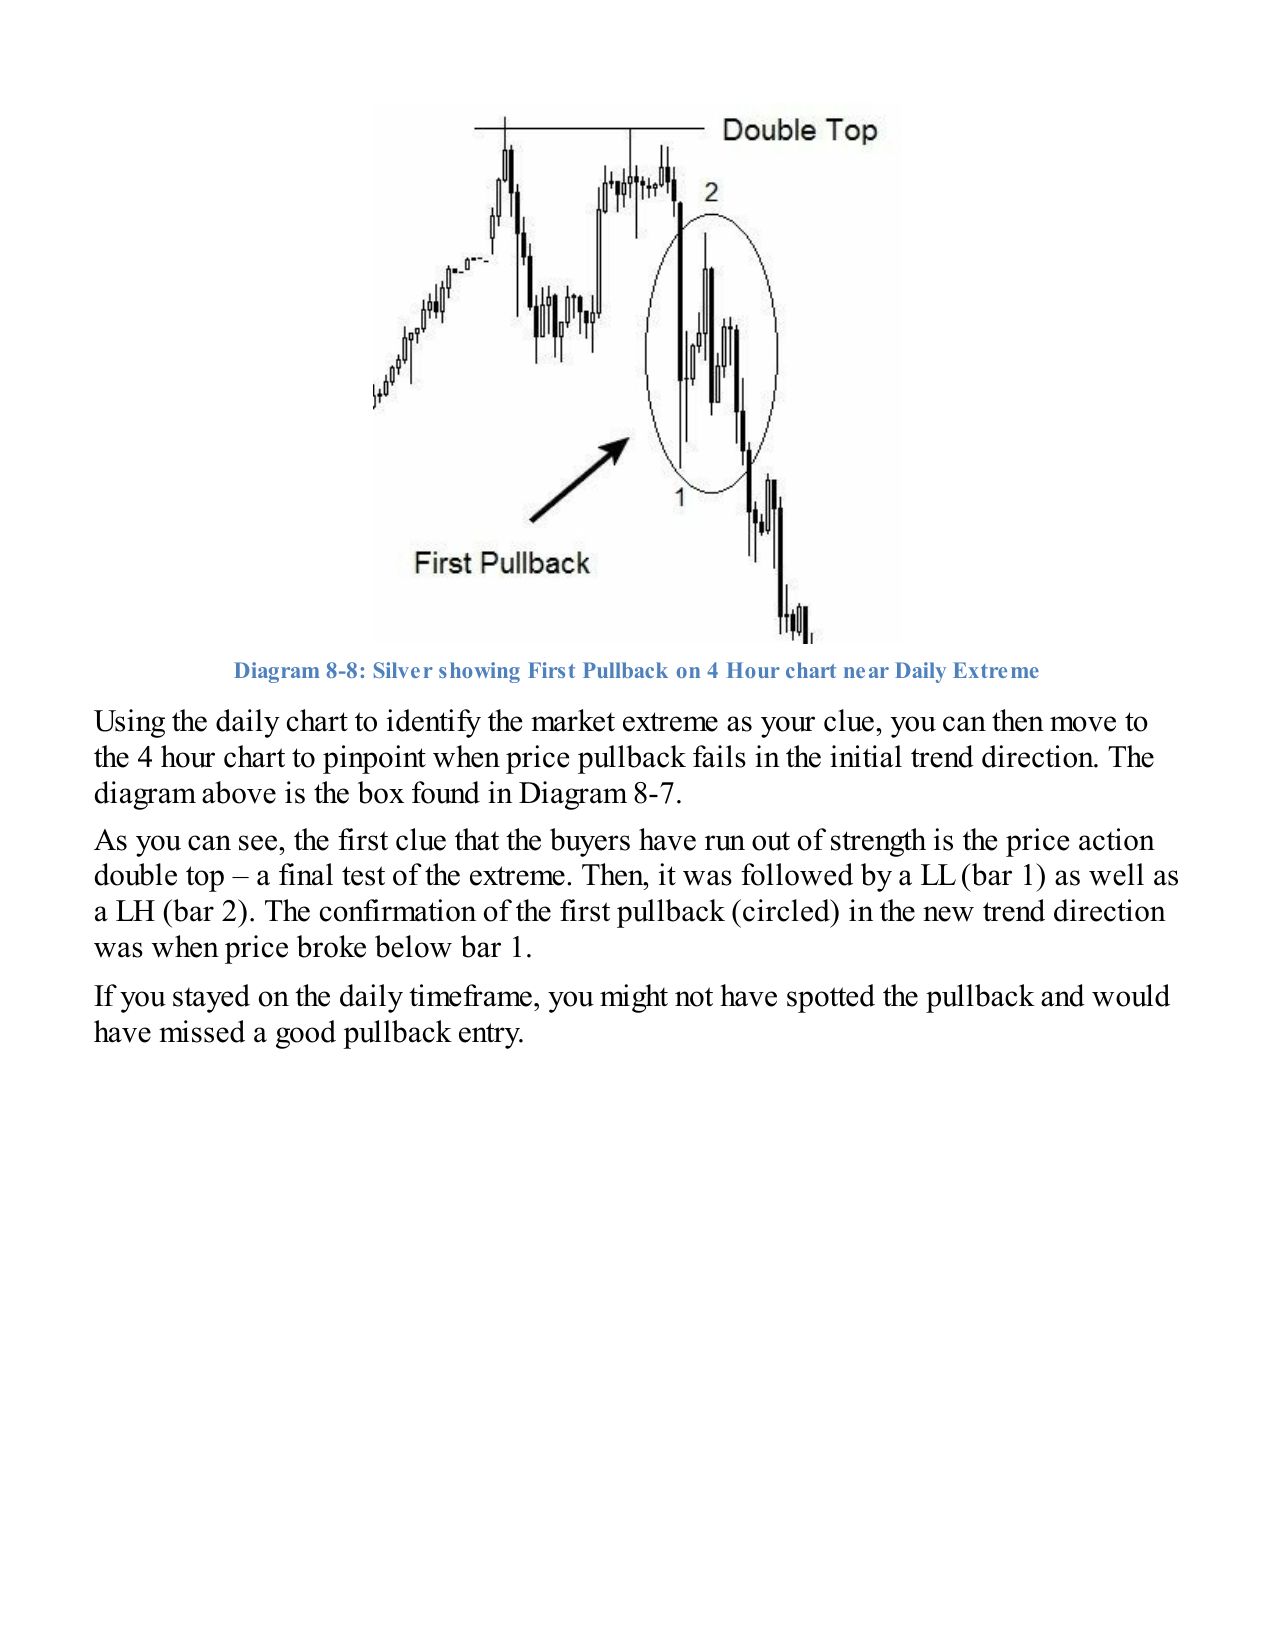
The first pullback is the first with-trend entry immediately after price has reversed from the old trend. It carries the best risk-to-reward of any entry in the entire pullback framework.
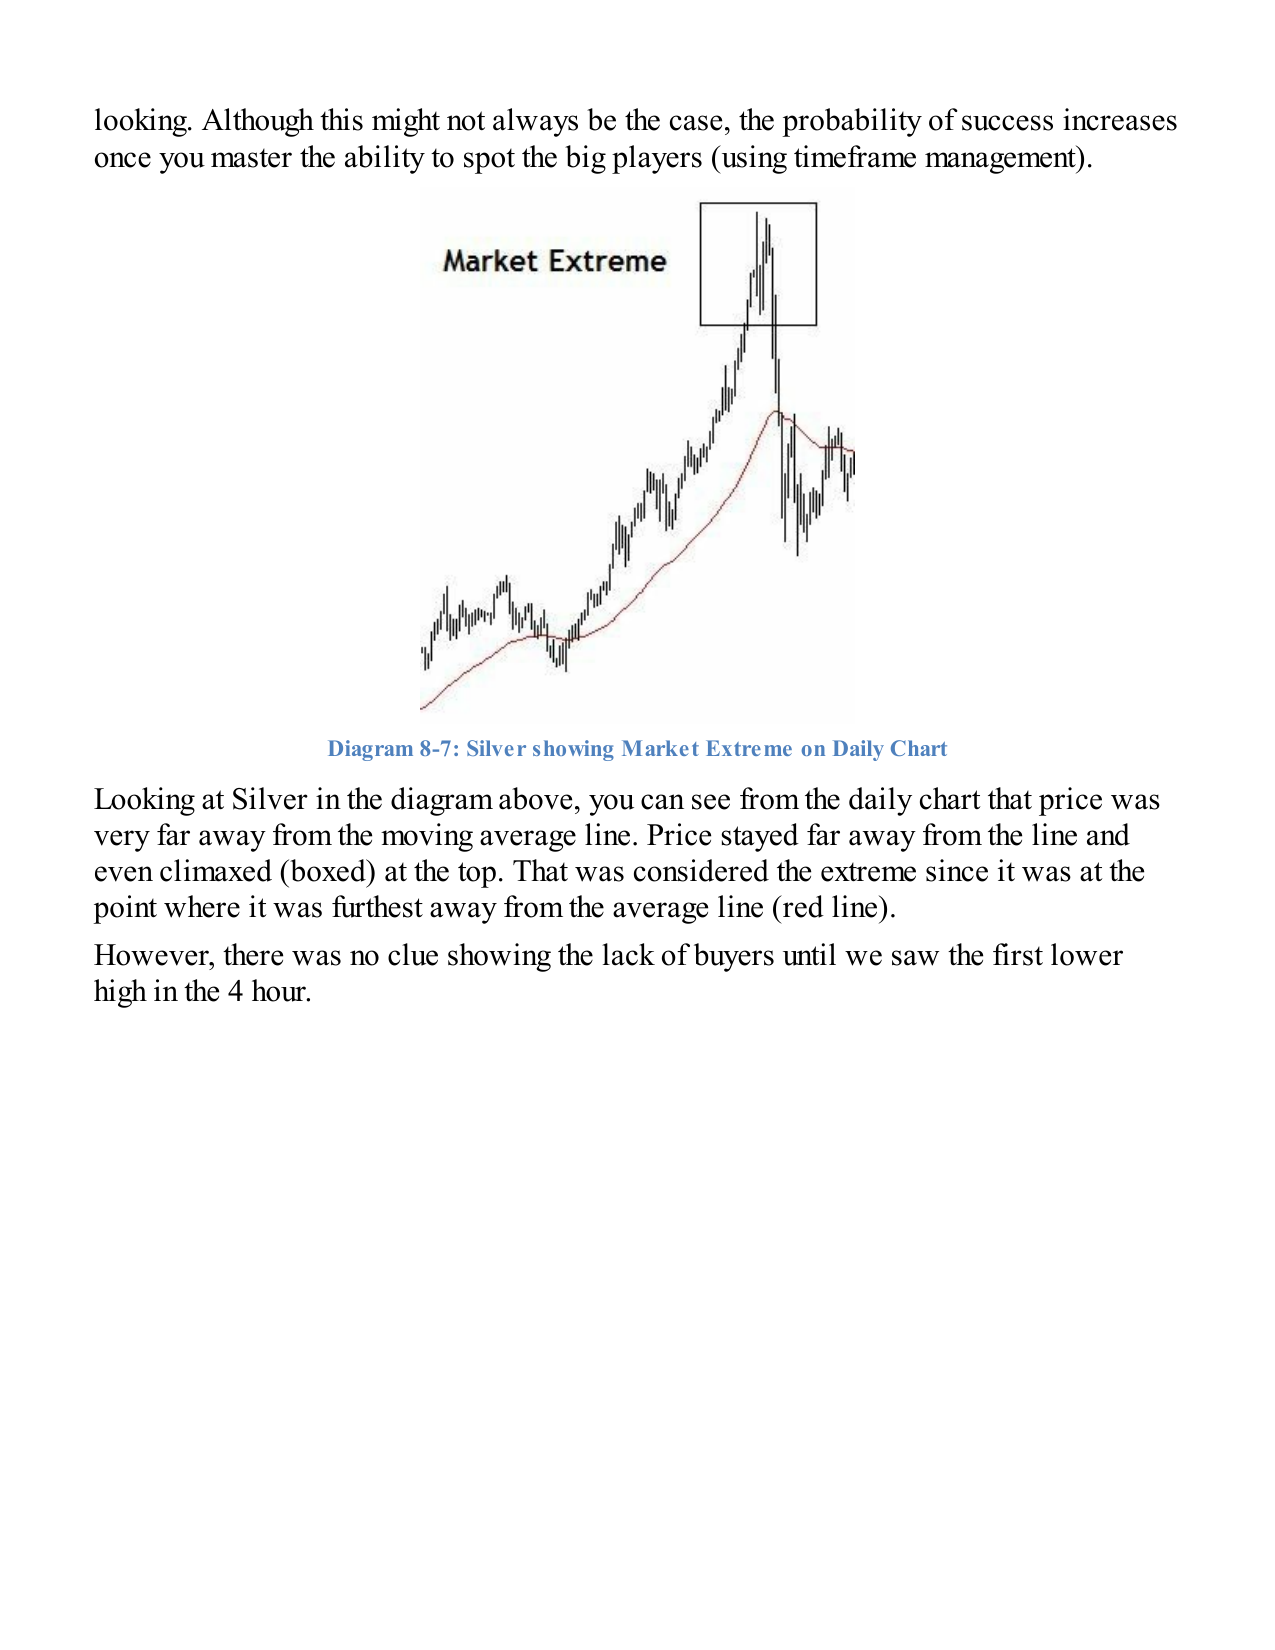
Silver — Market Extreme (p.82): The old trend reaches its final test — a lower high (in an uptrend) or higher low (in a downtrend) signals that the dominant side is losing control. This is the setup condition for the first pullback entry.Silver — First Pullback (p.83): After the convicted break of the old extreme, price pulls back for the first time in the new direction. This first pullback is the entry — the new BC that, when broken to the downside, fires the D-leg.
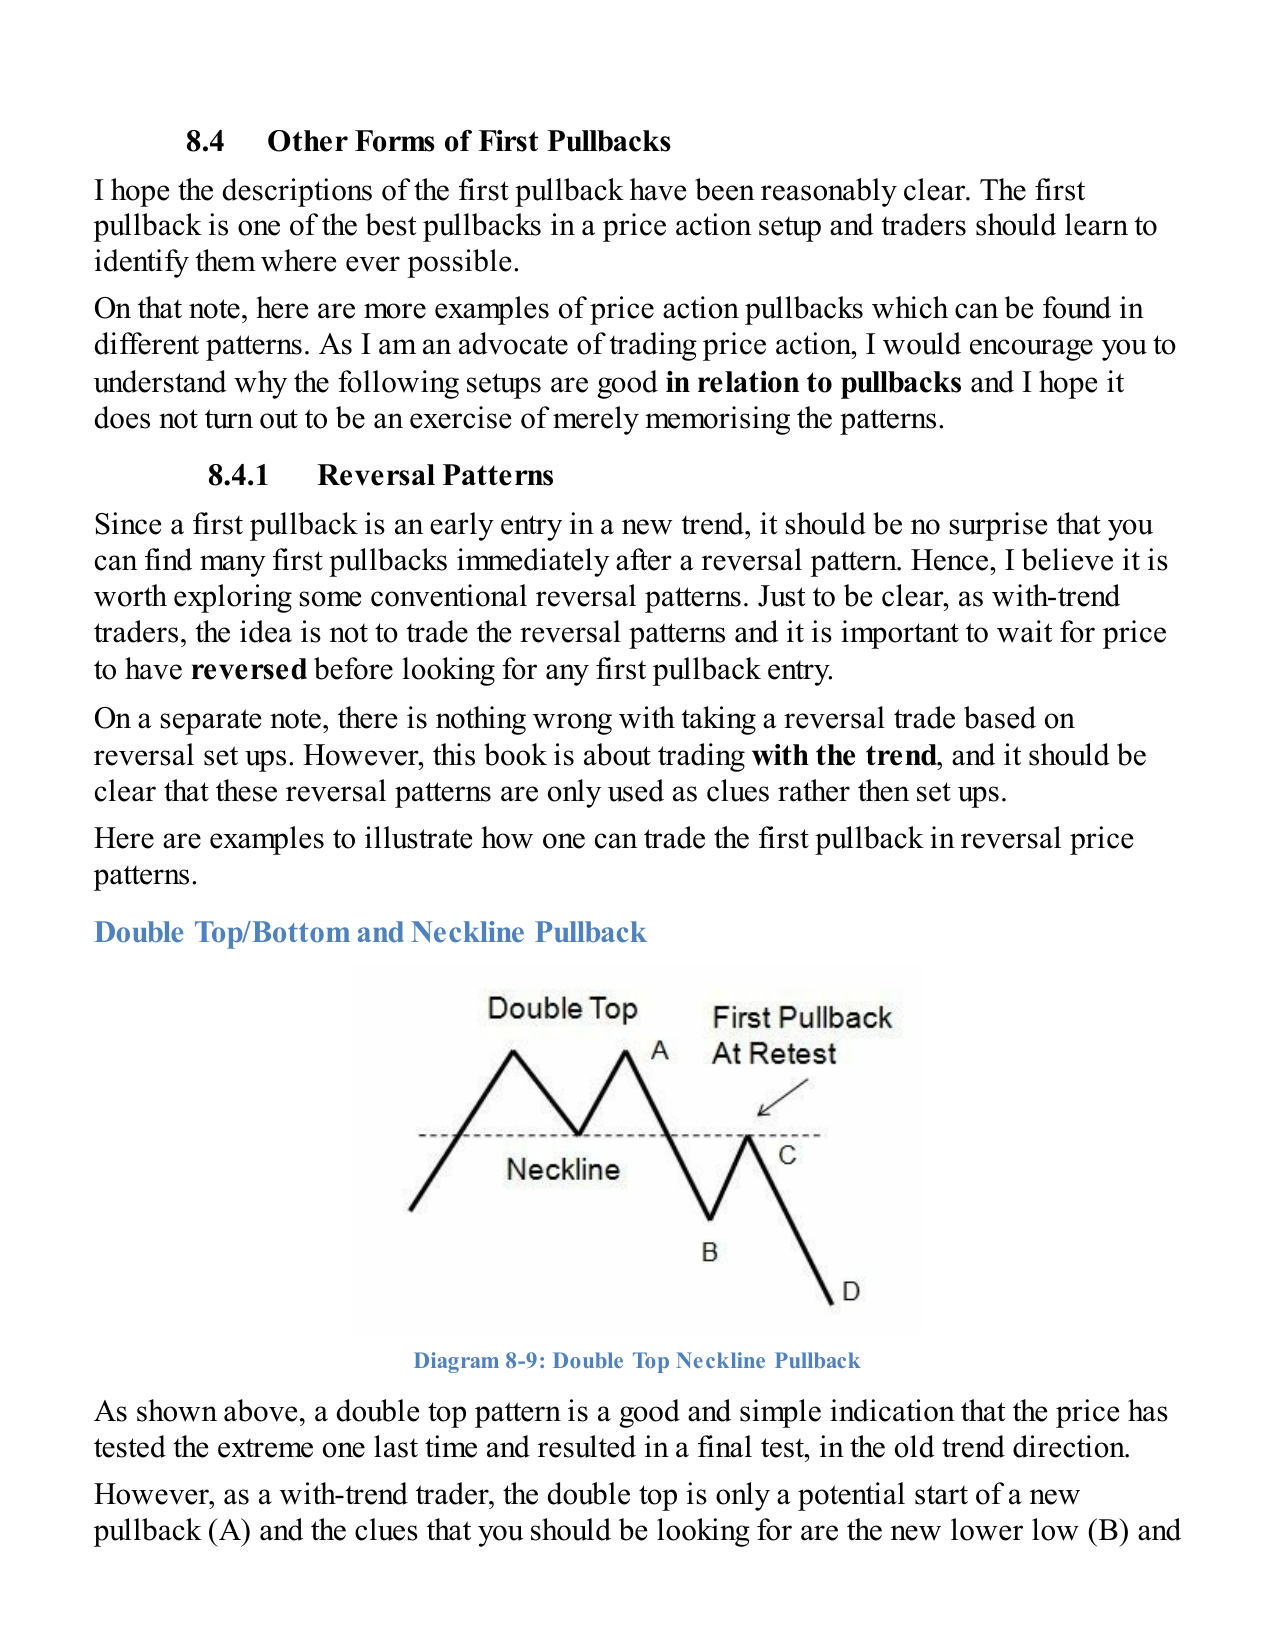
Reversal Patterns That Create First Pullbacks
Each of these classic reversal structures produces a first pullback after the neckline or breakout level is breached. The retest of that level is the entry.
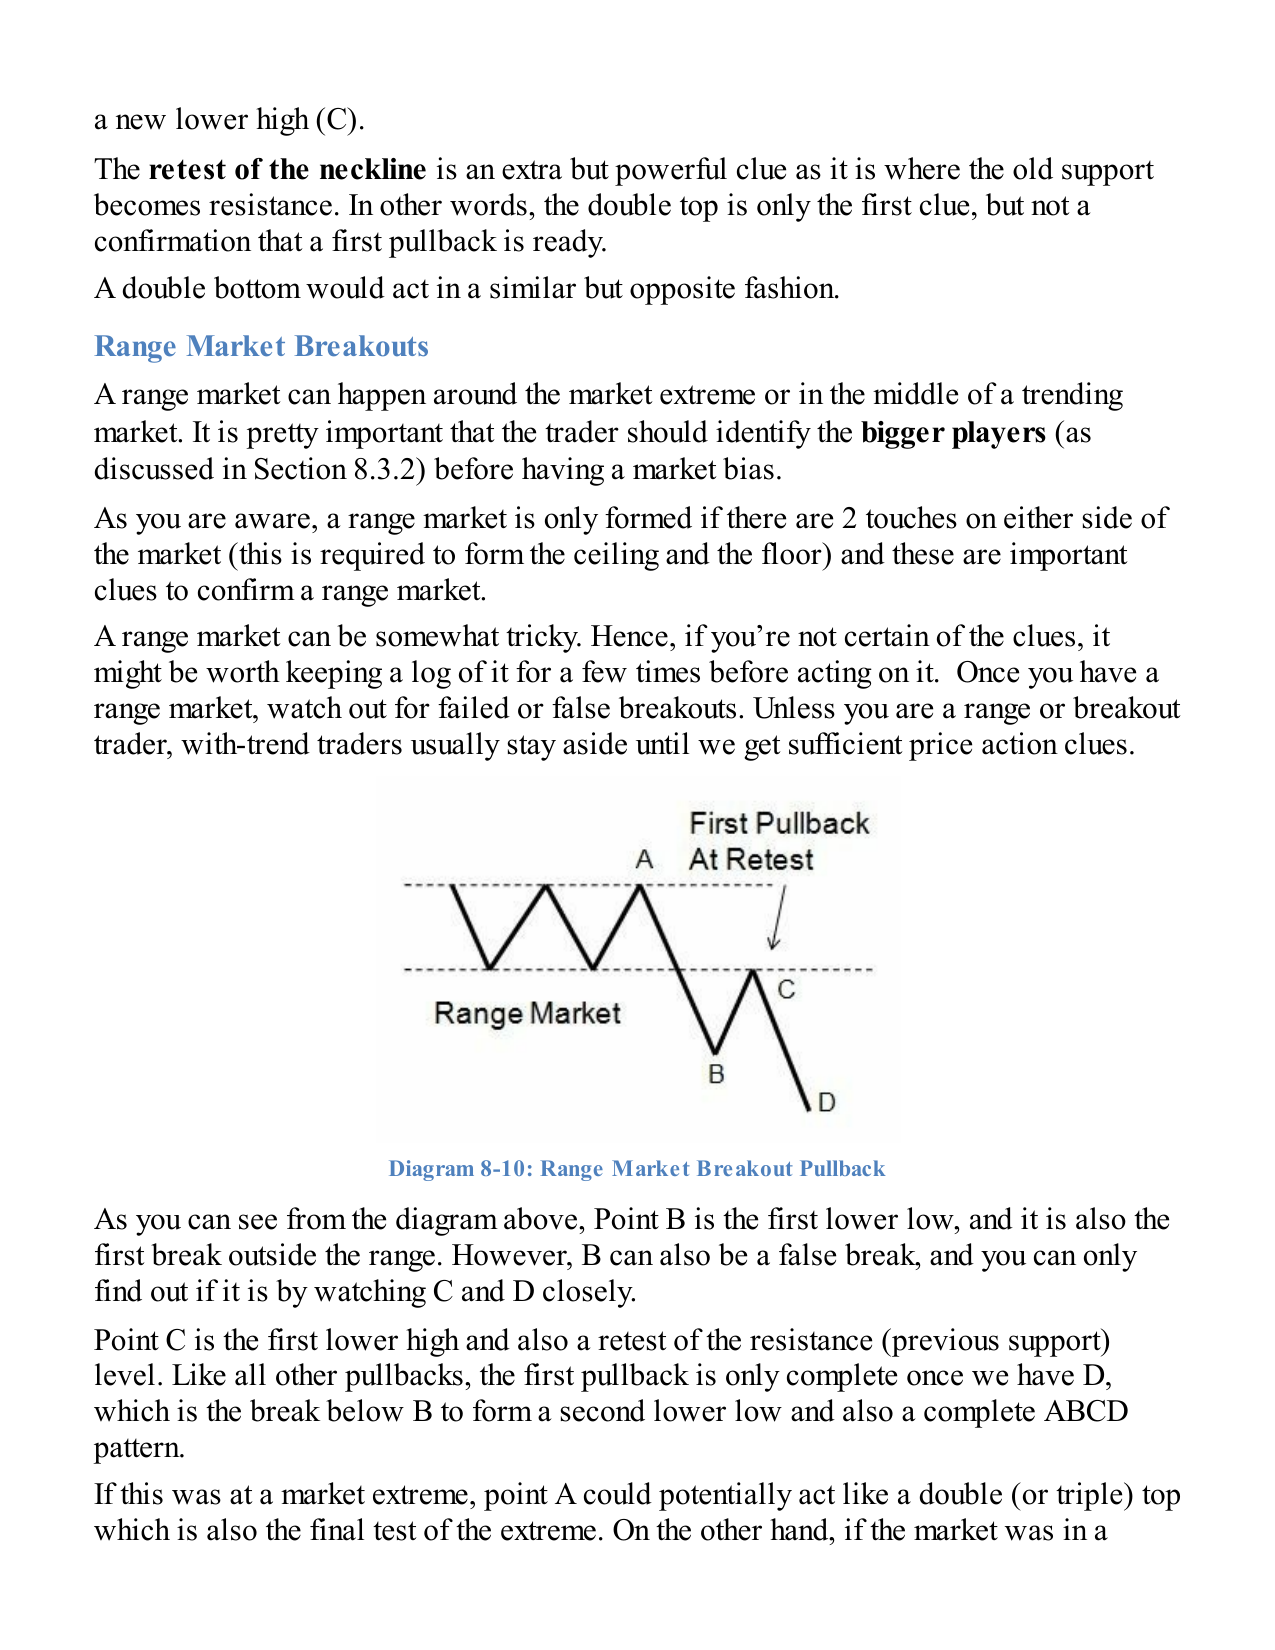
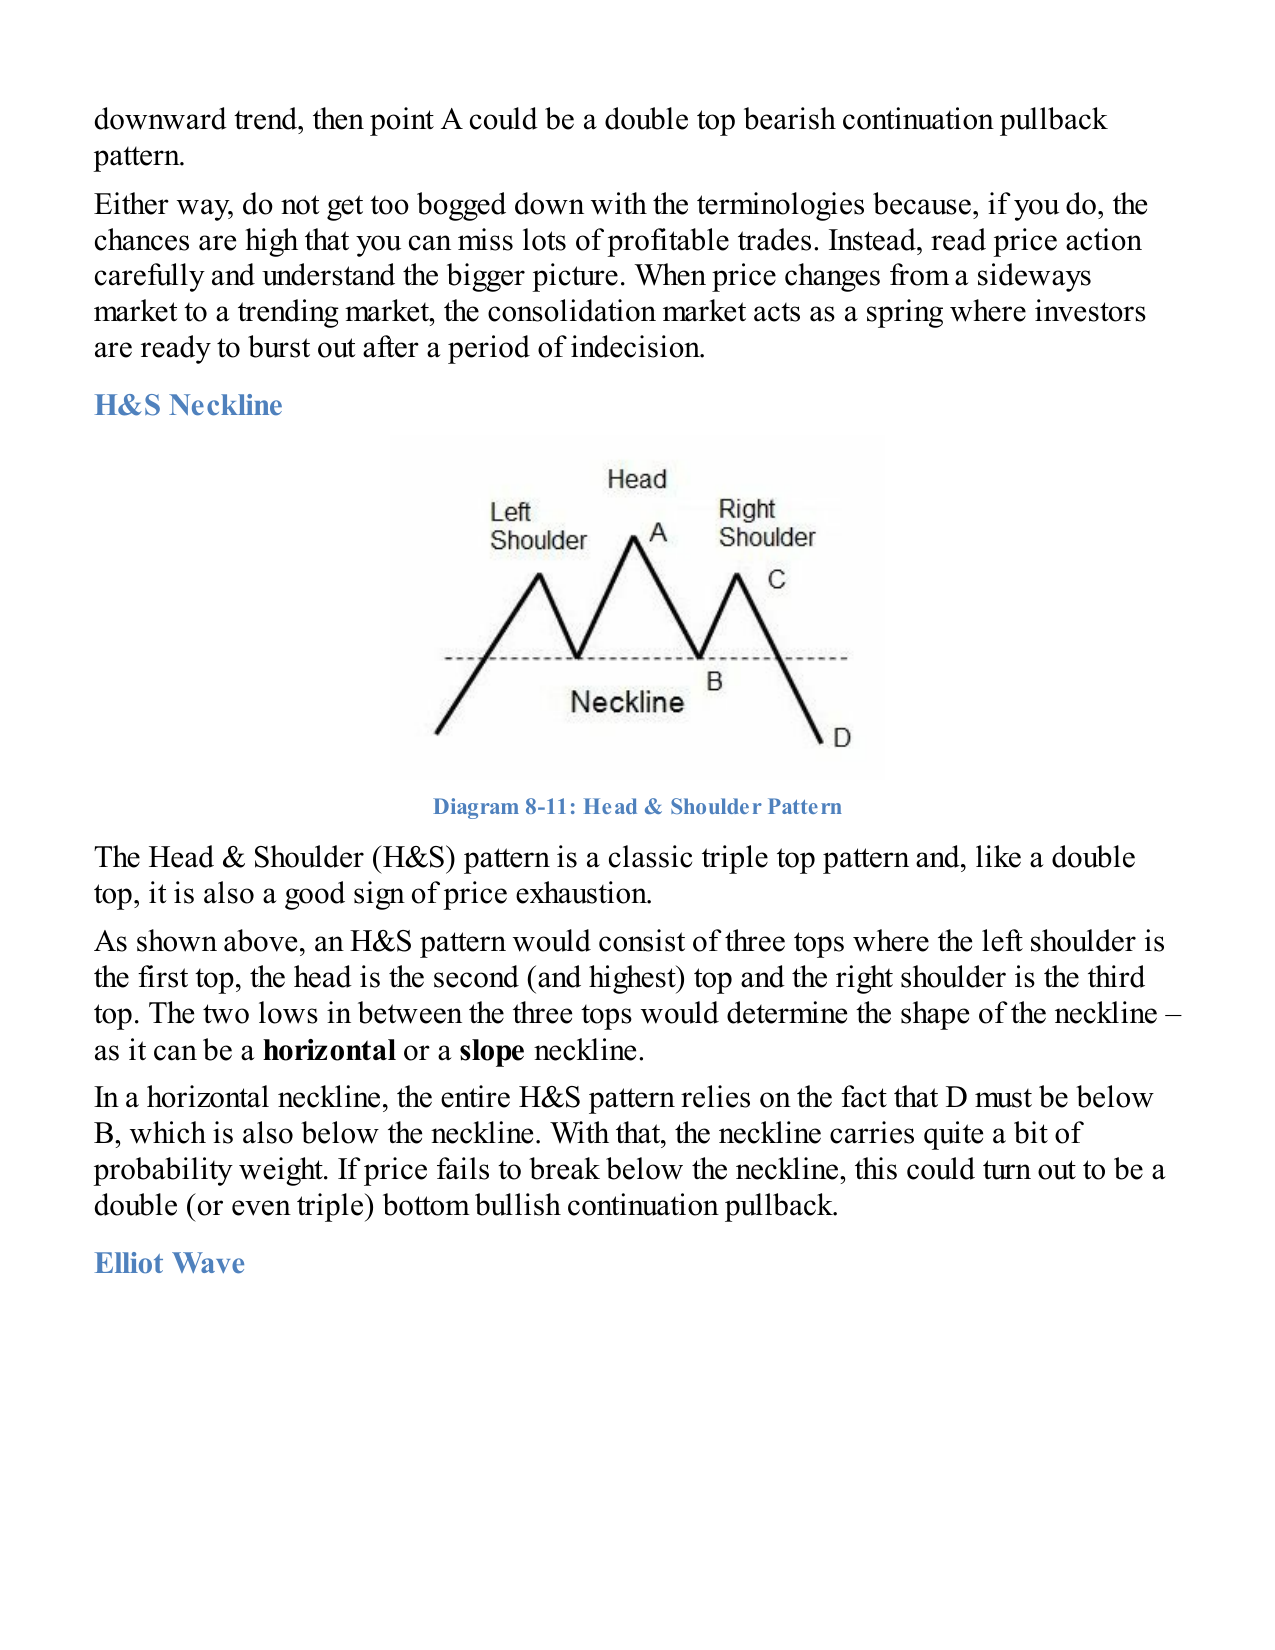
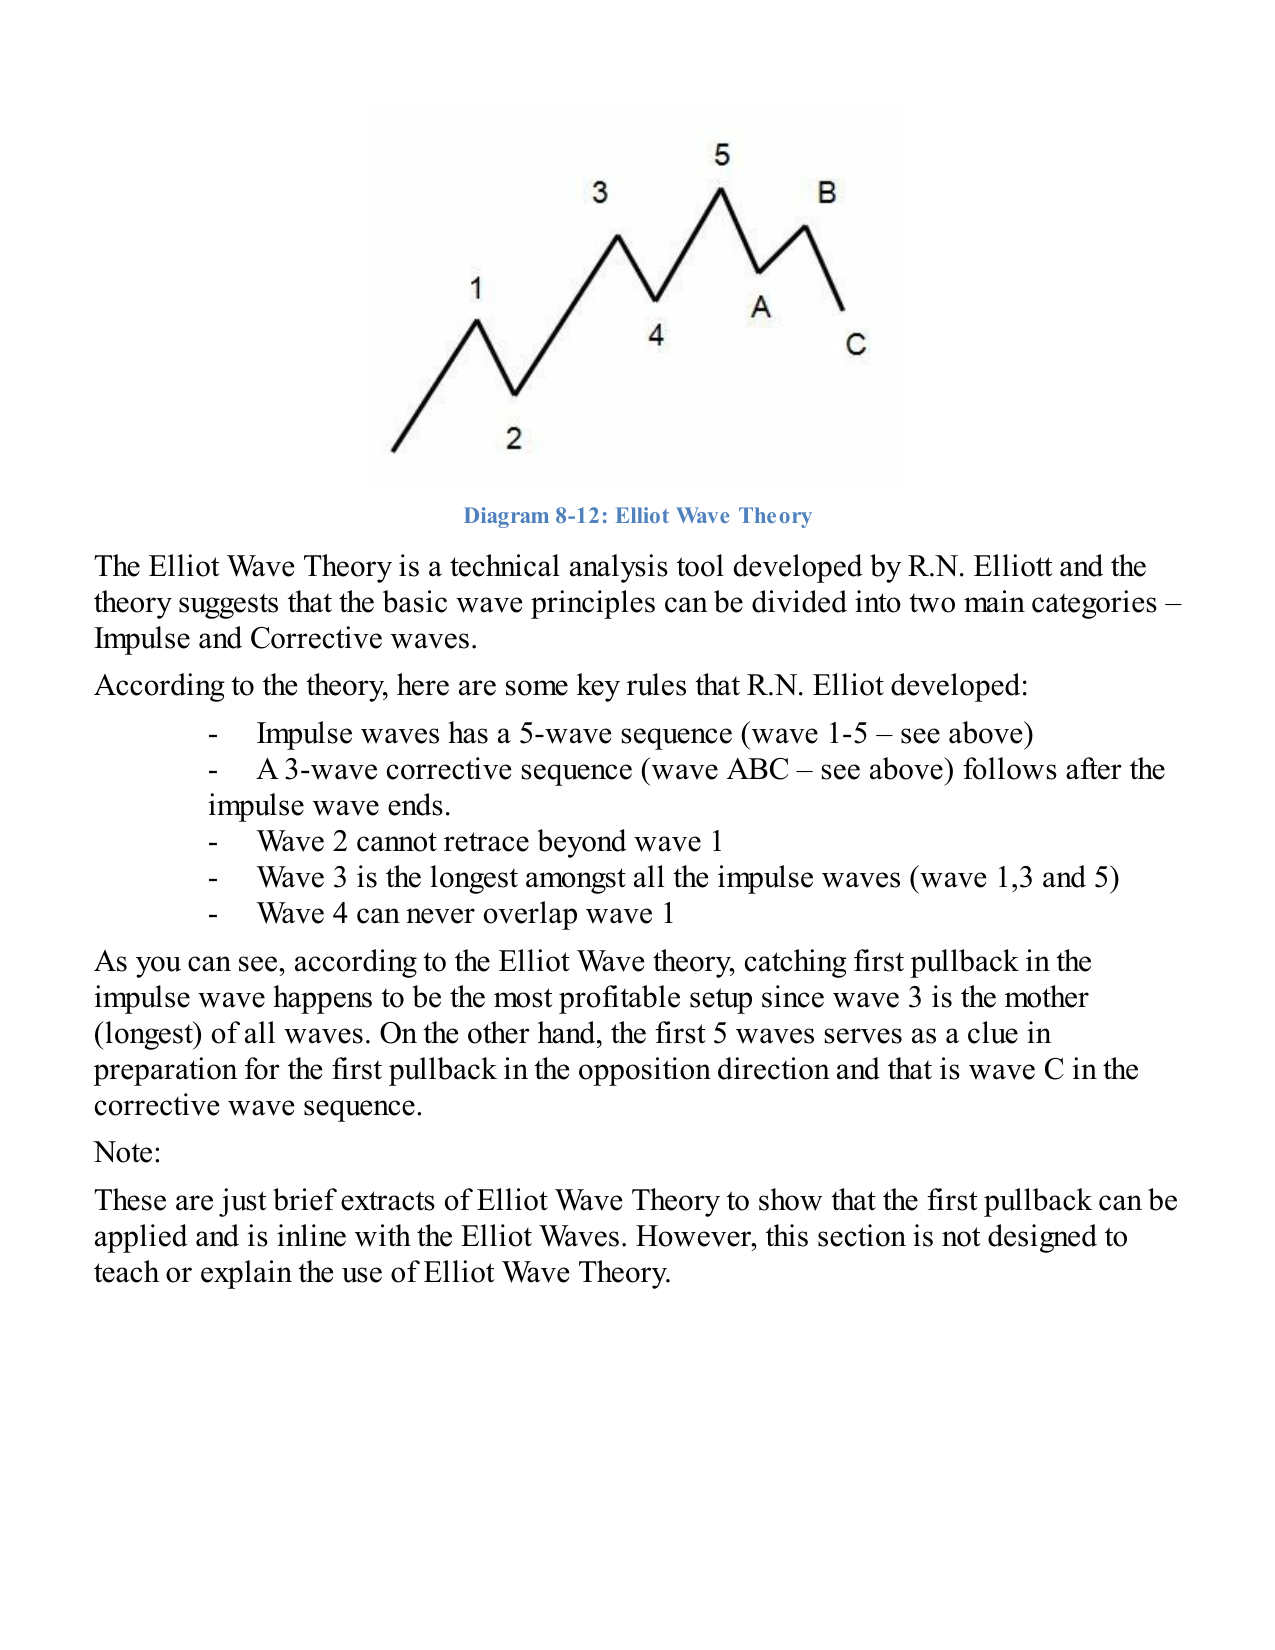
Double Top Neckline (p.84): Break below neckline, then retest of neckline as resistance. The retest is the first pullback — short entry with stop above the neckline retest high.Range Breakout (p.85): Price breaks the floor or ceiling of a range, then pulls back to retest the broken boundary. That retest is the first pullback — the boundary now acts as support or resistance.Head & Shoulders (p.86): Right shoulder forms at a lower high. After the neckline breaks, the first pullback is the retest of the neckline from below. One of the most reliable first pullback setups available.Elliott Wave (p.87): Wave 2 completes the first corrective move after the initial impulse (Wave 1). Entering at the end of Wave 2 means riding Wave 3 — typically the longest and most profitable leg of the entire sequence.
7. Invalidation Rules
The fear that "this could be the one that keeps dropping" is solved by defining exactly where the setup is wrong.
20 EMA failure: if price closes decisively below the 20 EMA on heavy volume, the pullback is suspect.
Pullback low break: if price breaks the low that defined the setup, the immediate trade is invalidated.
Breakout retest failure: if old resistance does not act as support and price cannot reclaim it, the breakout has failed.
Volume warning: falling on rising sell volume is different from drifting down on quiet volume.
Stop too wide: if the required stop is too far away, the entry is late even if the chart is strong.
Simple invalidation rule: if price slices through the 20 EMA or breakout level on heavy volume and cannot reclaim it, the pullback is probably broken.
8. Final Checklist Before Entry
Is the stock or coin already in an uptrend?
Was there a clear impulse move before the pullback?
Is the pullback controlled rather than violent?
Is price near a logical support area?
Has volume calmed on the pullback?
Have buyers actually reappeared?
Do I know exactly where the trade is wrong?
Is the stop distance acceptable?
Is there enough upside before the next resistance?
Am I buying the turn, not the fall?
Final rule: if the chart cannot be marked with a clear buy zone, trigger, invalidation level and target, it is not yet a trade.