01 — Fundamentals
What Is a Pullback?
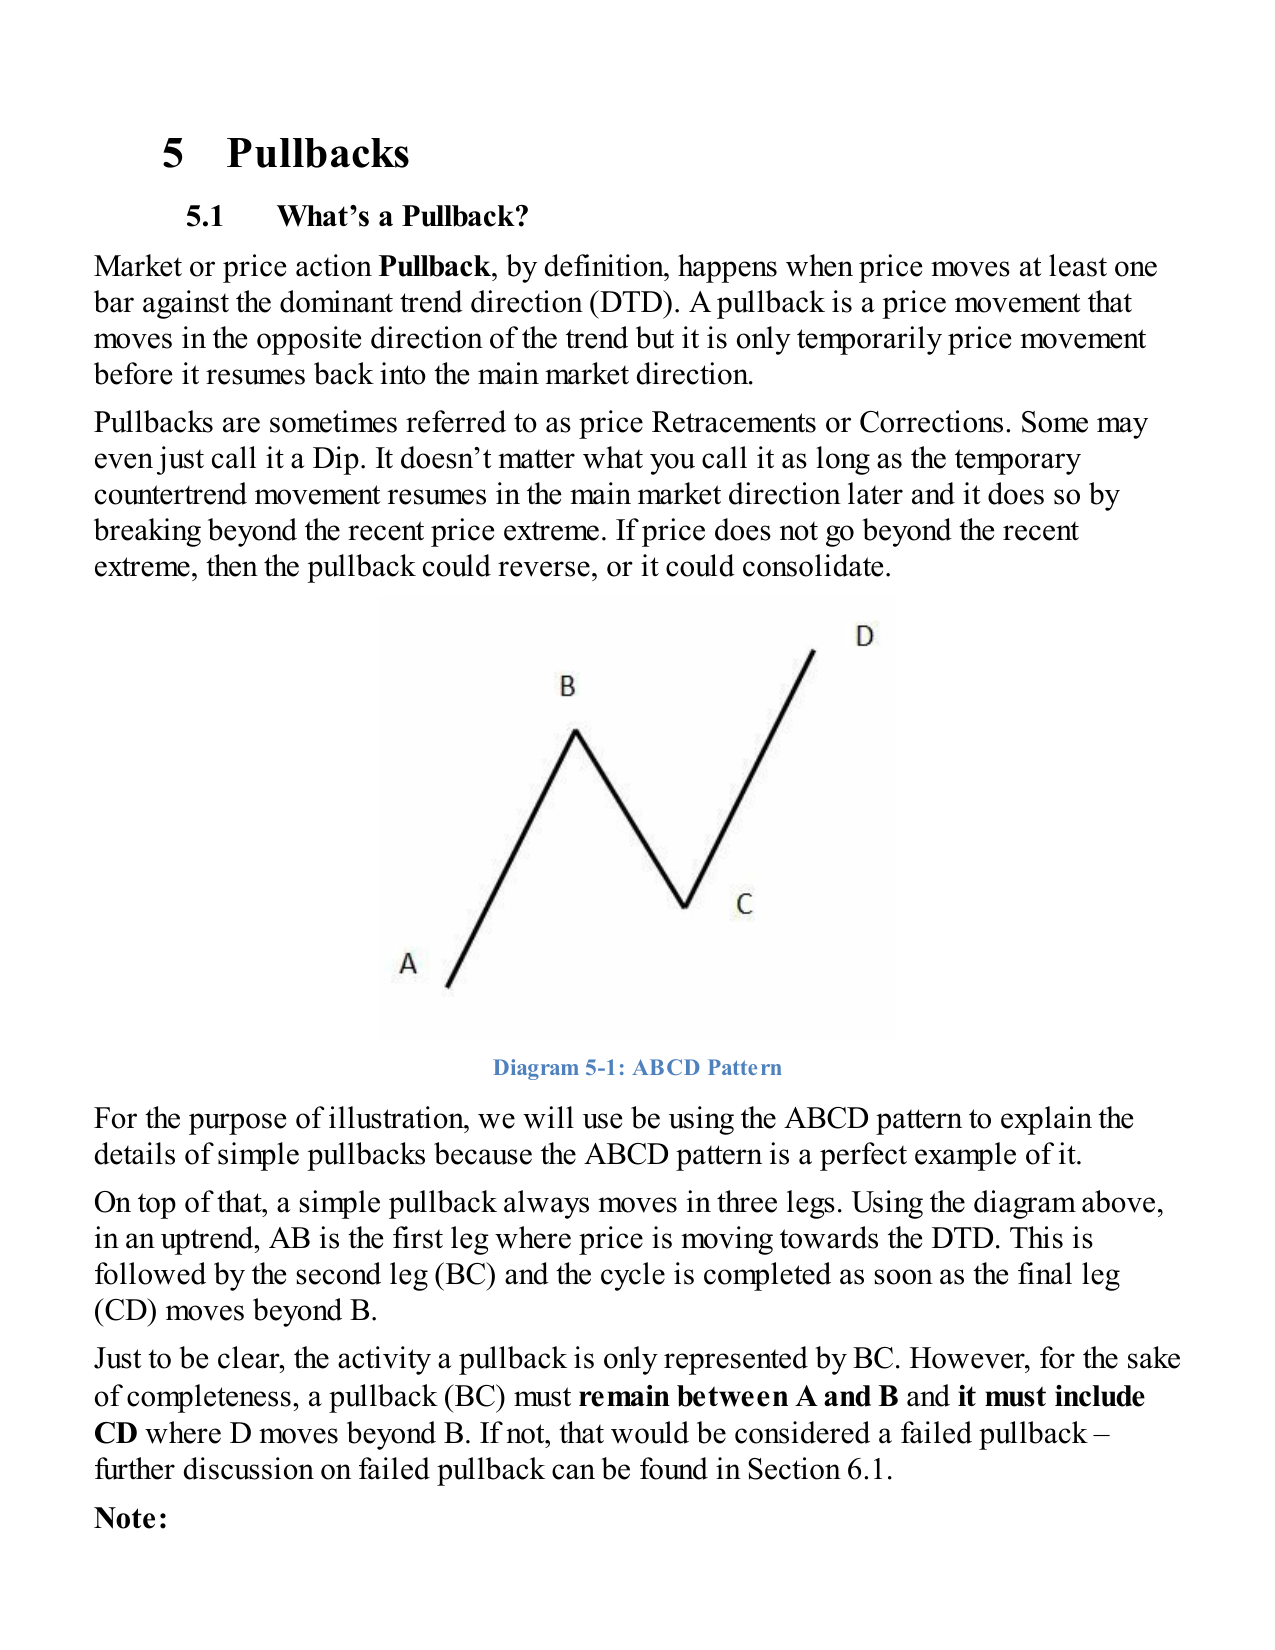
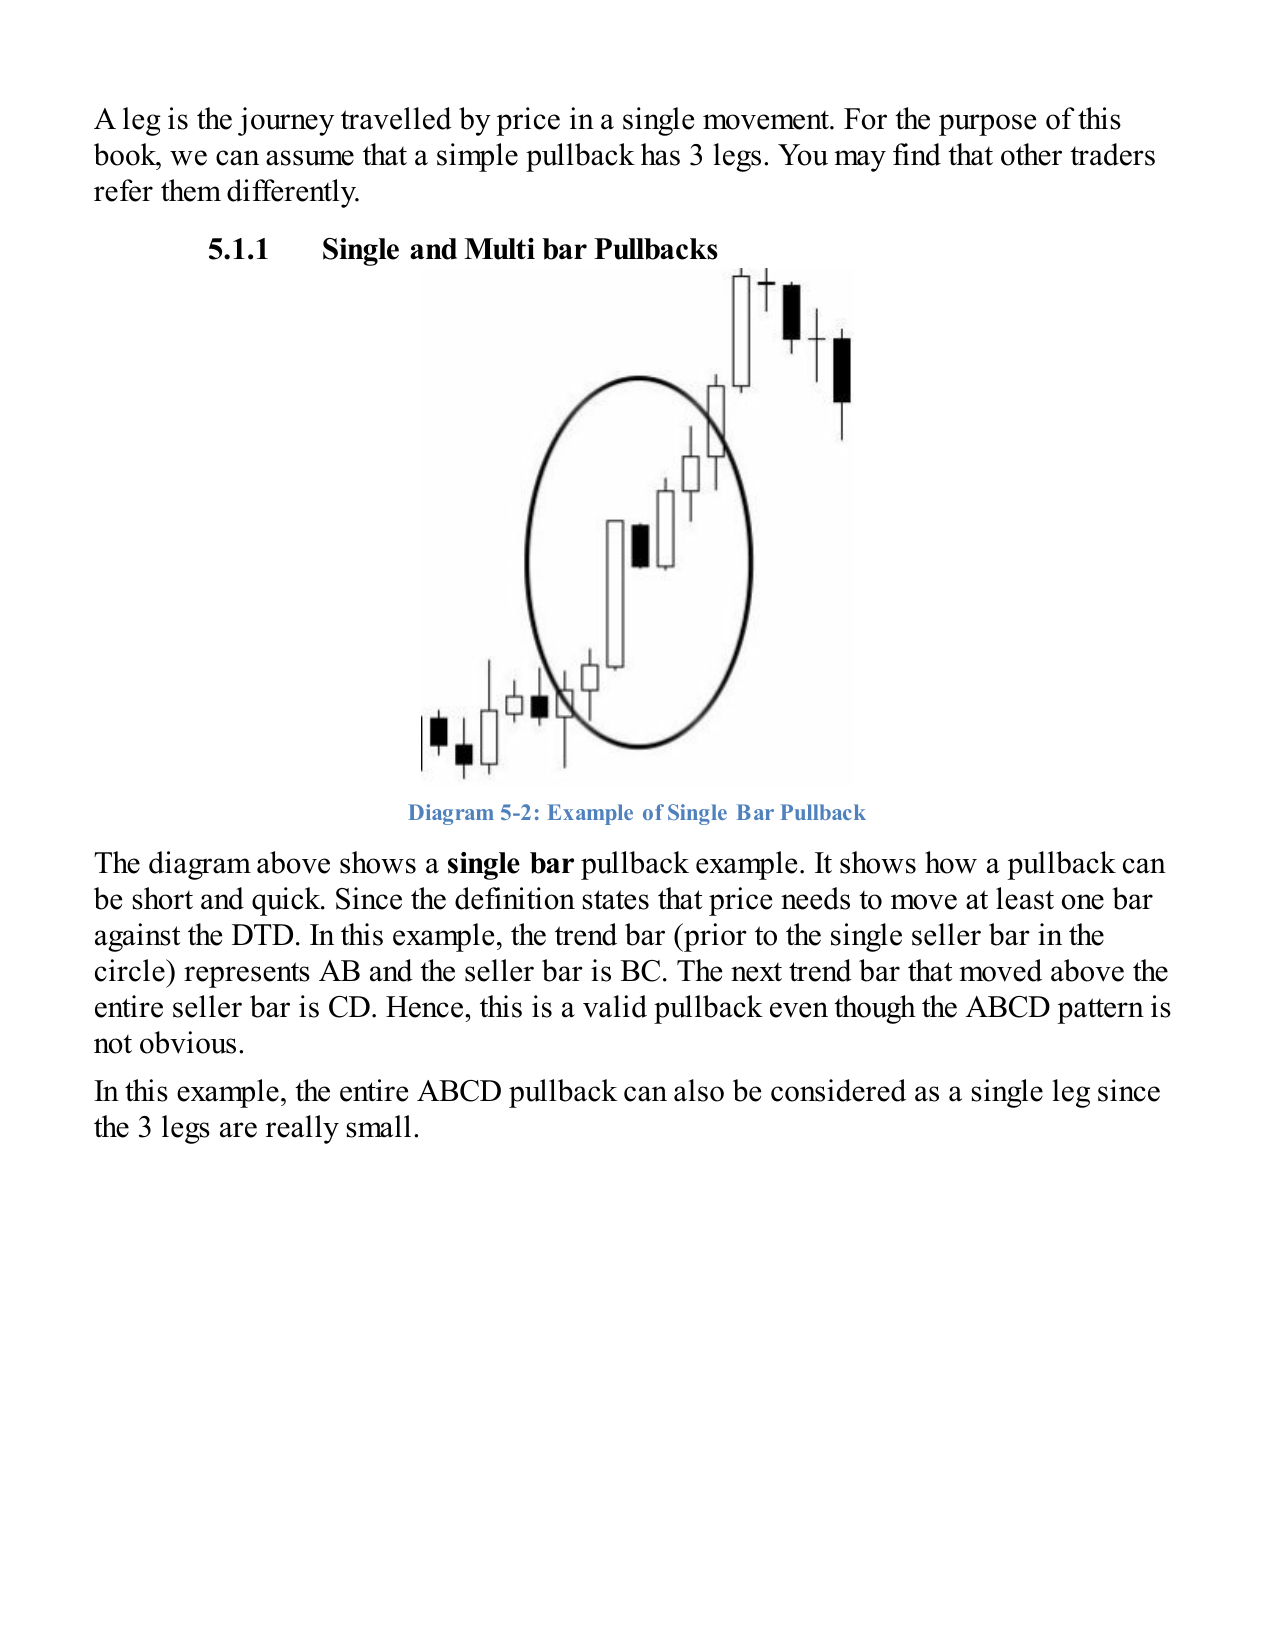
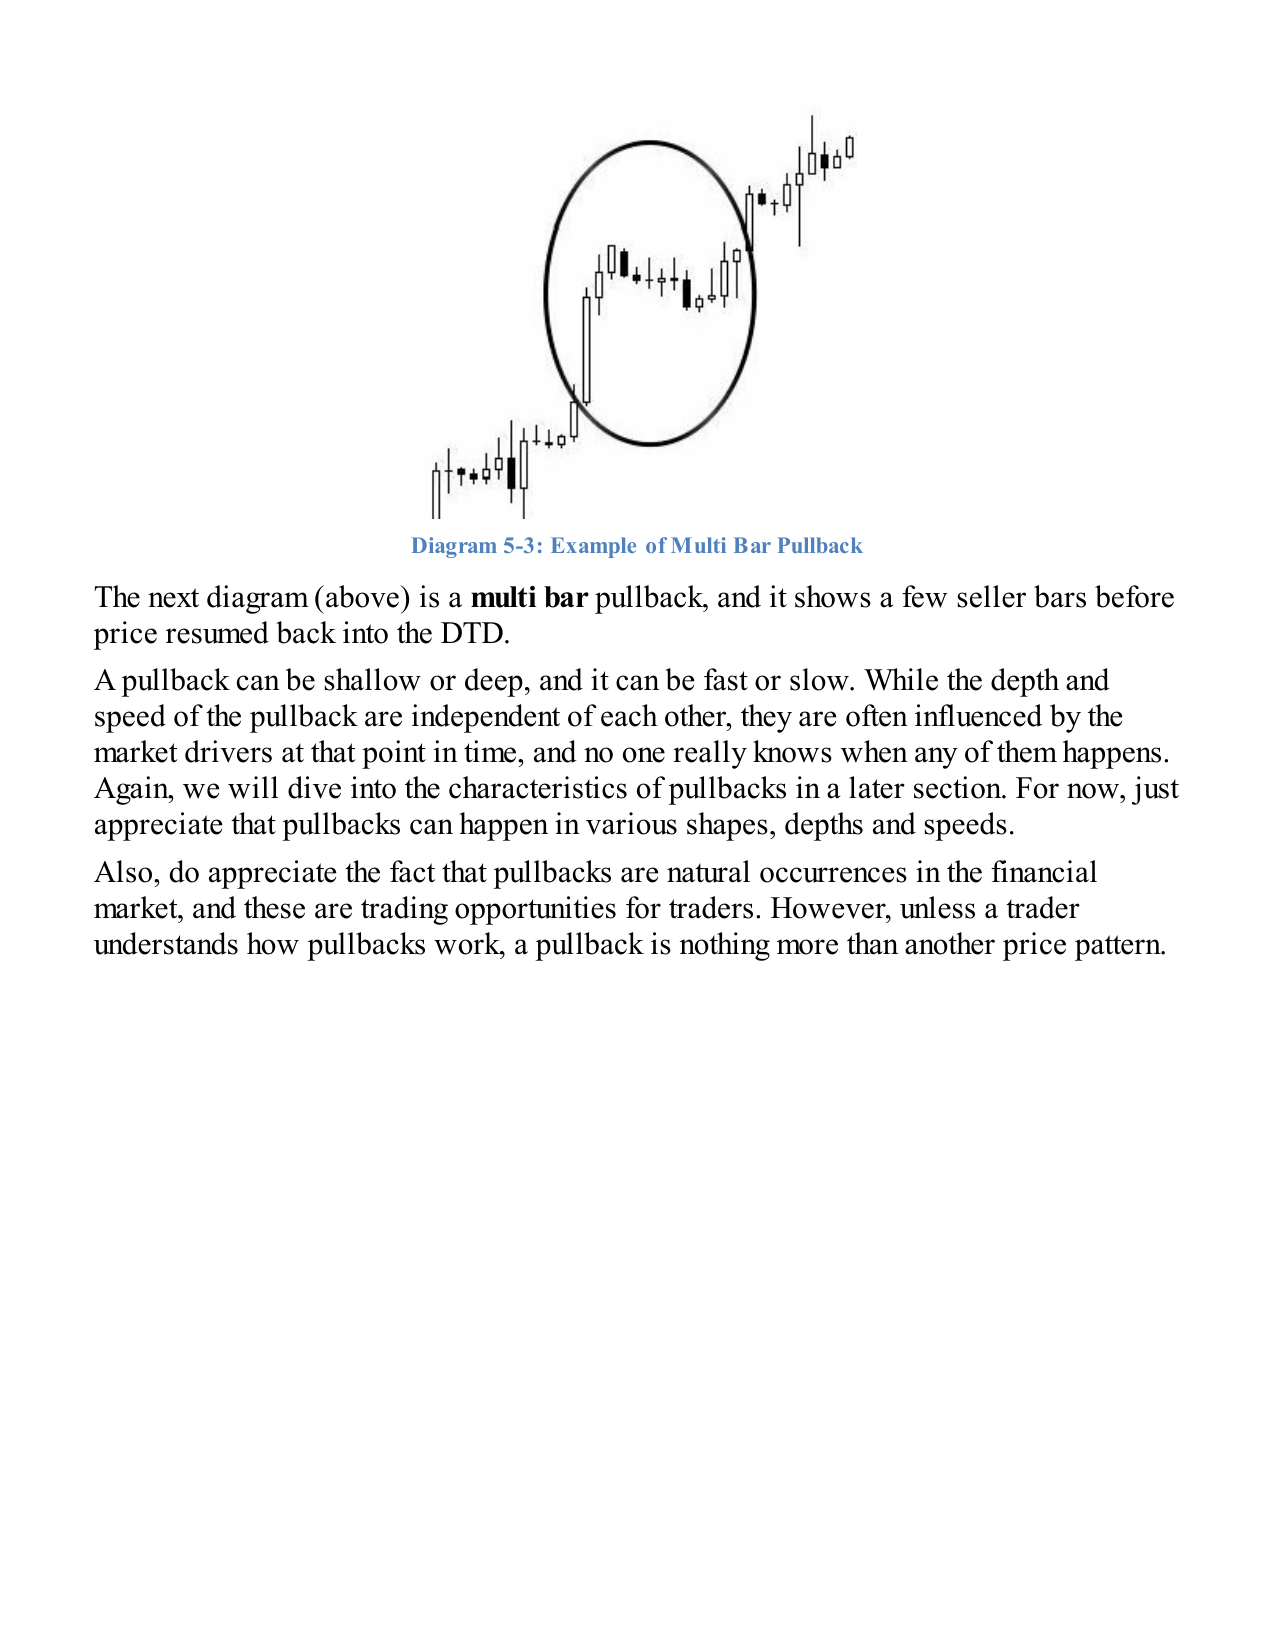
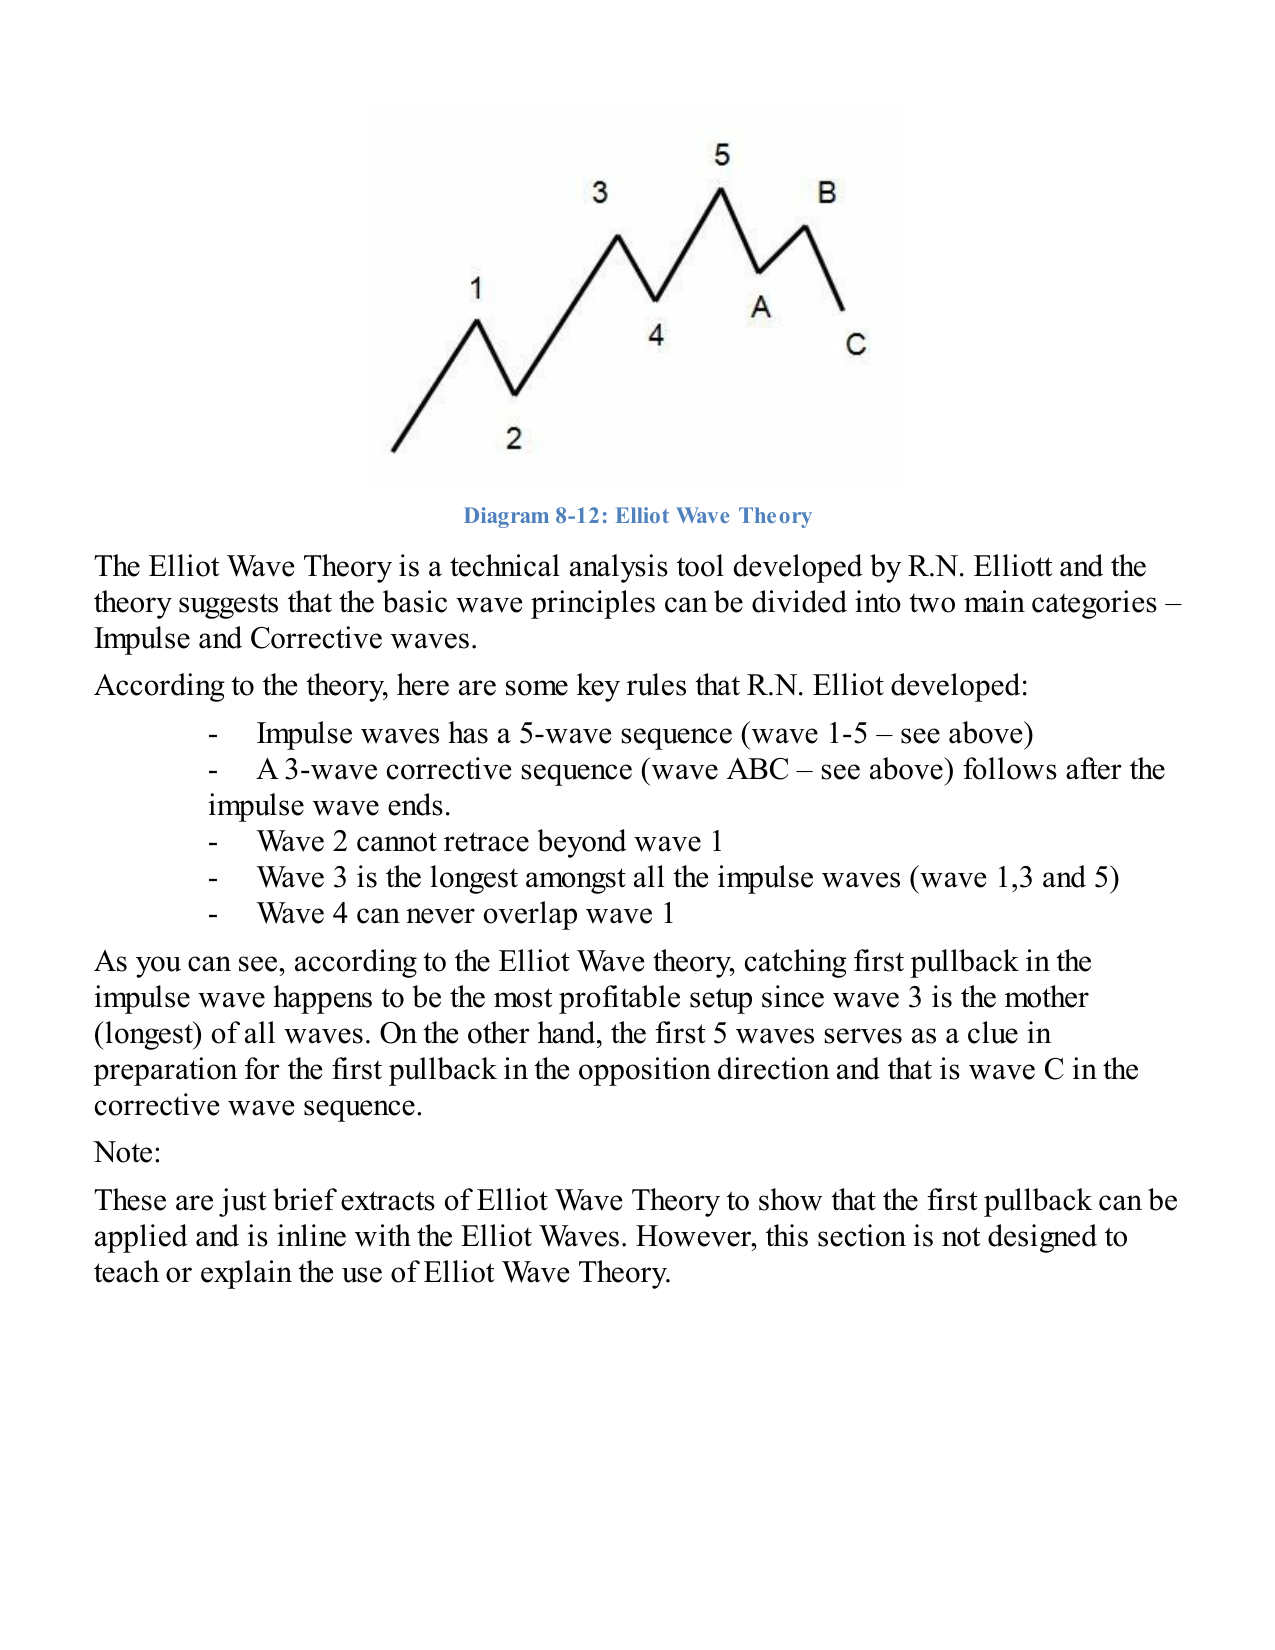
A market pullback occurs when price moves at least one bar against the dominant trend direction (DTD) before resuming in that same direction. It is a temporary counter-trend movement — sometimes called a retracement, correction, or dip — that, when completed, breaks beyond the recent price extreme.
The underlying mechanism is Mean Reversion: price always moves away from the mean before reaching an extreme, then gets pulled back toward the average — like a pendulum. Pullbacks are the mechanism through which that reversion occurs. Crucially, this happens in every market condition (trending, reversing, and ranging) and on every timeframe.
The ABCD pattern: AB = trend leg, BC = pullback (counter-trend), CD = resumption. D must exceed B for the pullback to be valid.
Core Rule
- BC is the pullback. It must stay between A and B.
- The pullback is only complete when D moves beyond B.
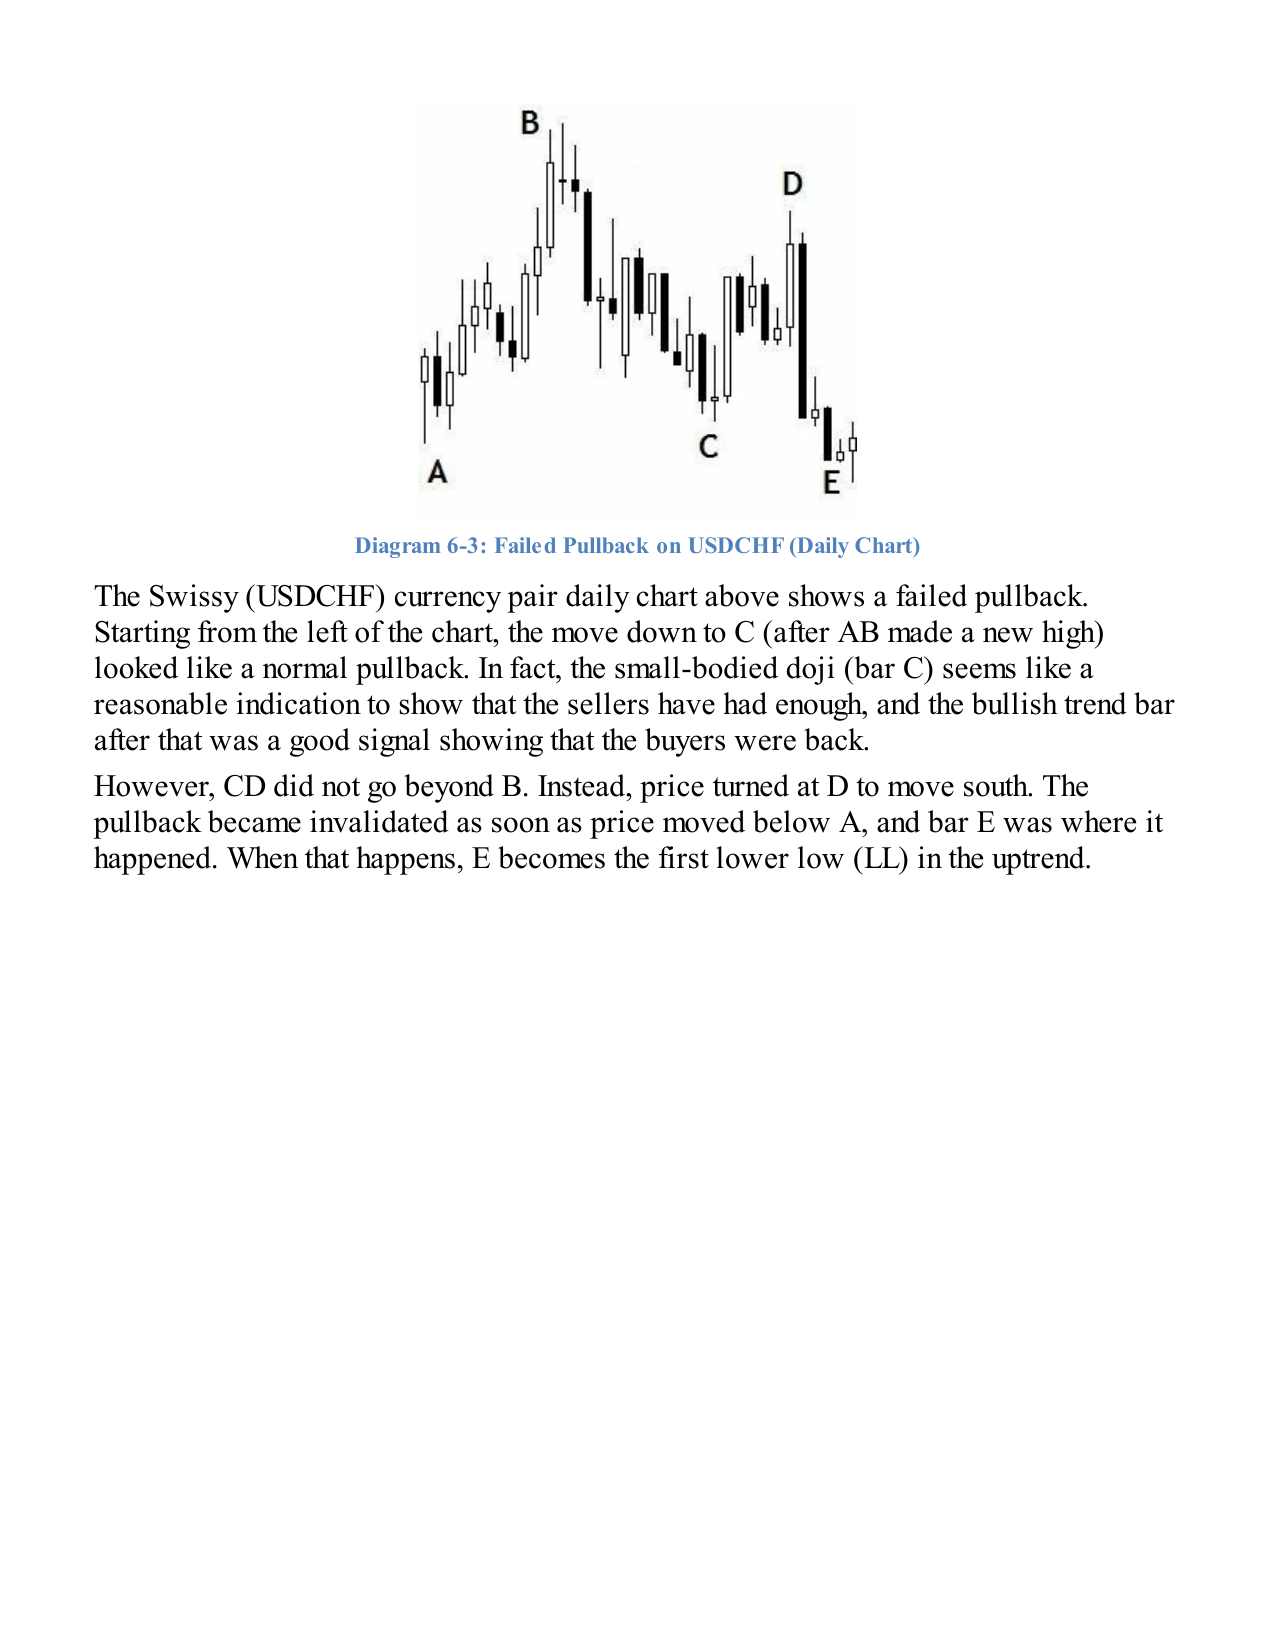
- If C breaks beyond A (not B), the pullback has failed — see Section 04.
02 — Taxonomy
Types of Pullback
The more pullback patterns a trader can recognise, the more prepared he or she is for any market condition. Pullbacks fall into two broad categories: simple and complex. Simple pullbacks are more profitable because they are faster to identify; complex pullbacks carry more uncertainty and, as a rule, should be avoided.
Simple Pullbacks
Simple — Type A
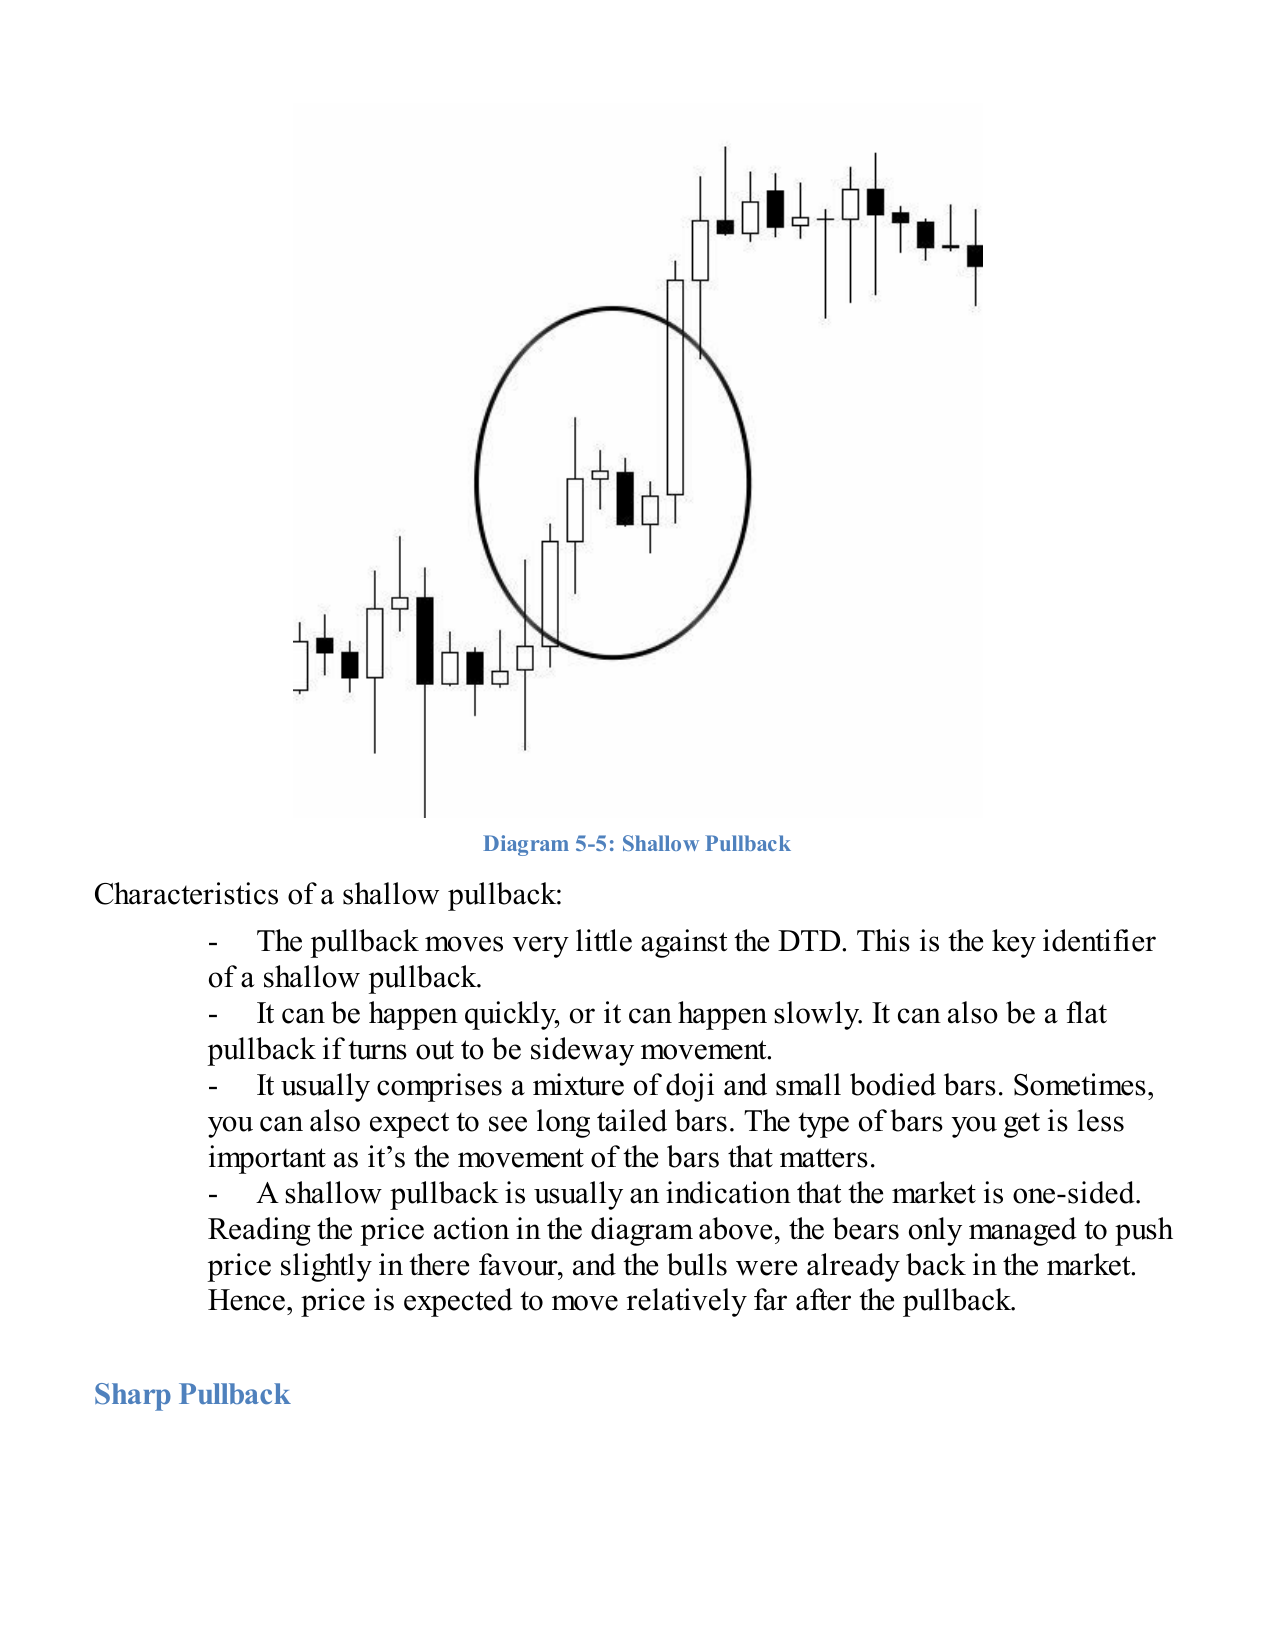
Shallow Pullback
Price moves very little against the DTD. Indicates a one-sided, strong market. Expect a substantial continuation move after completion. Associated with Fib ratios of 23.6–38.2%.
Simple — Type B
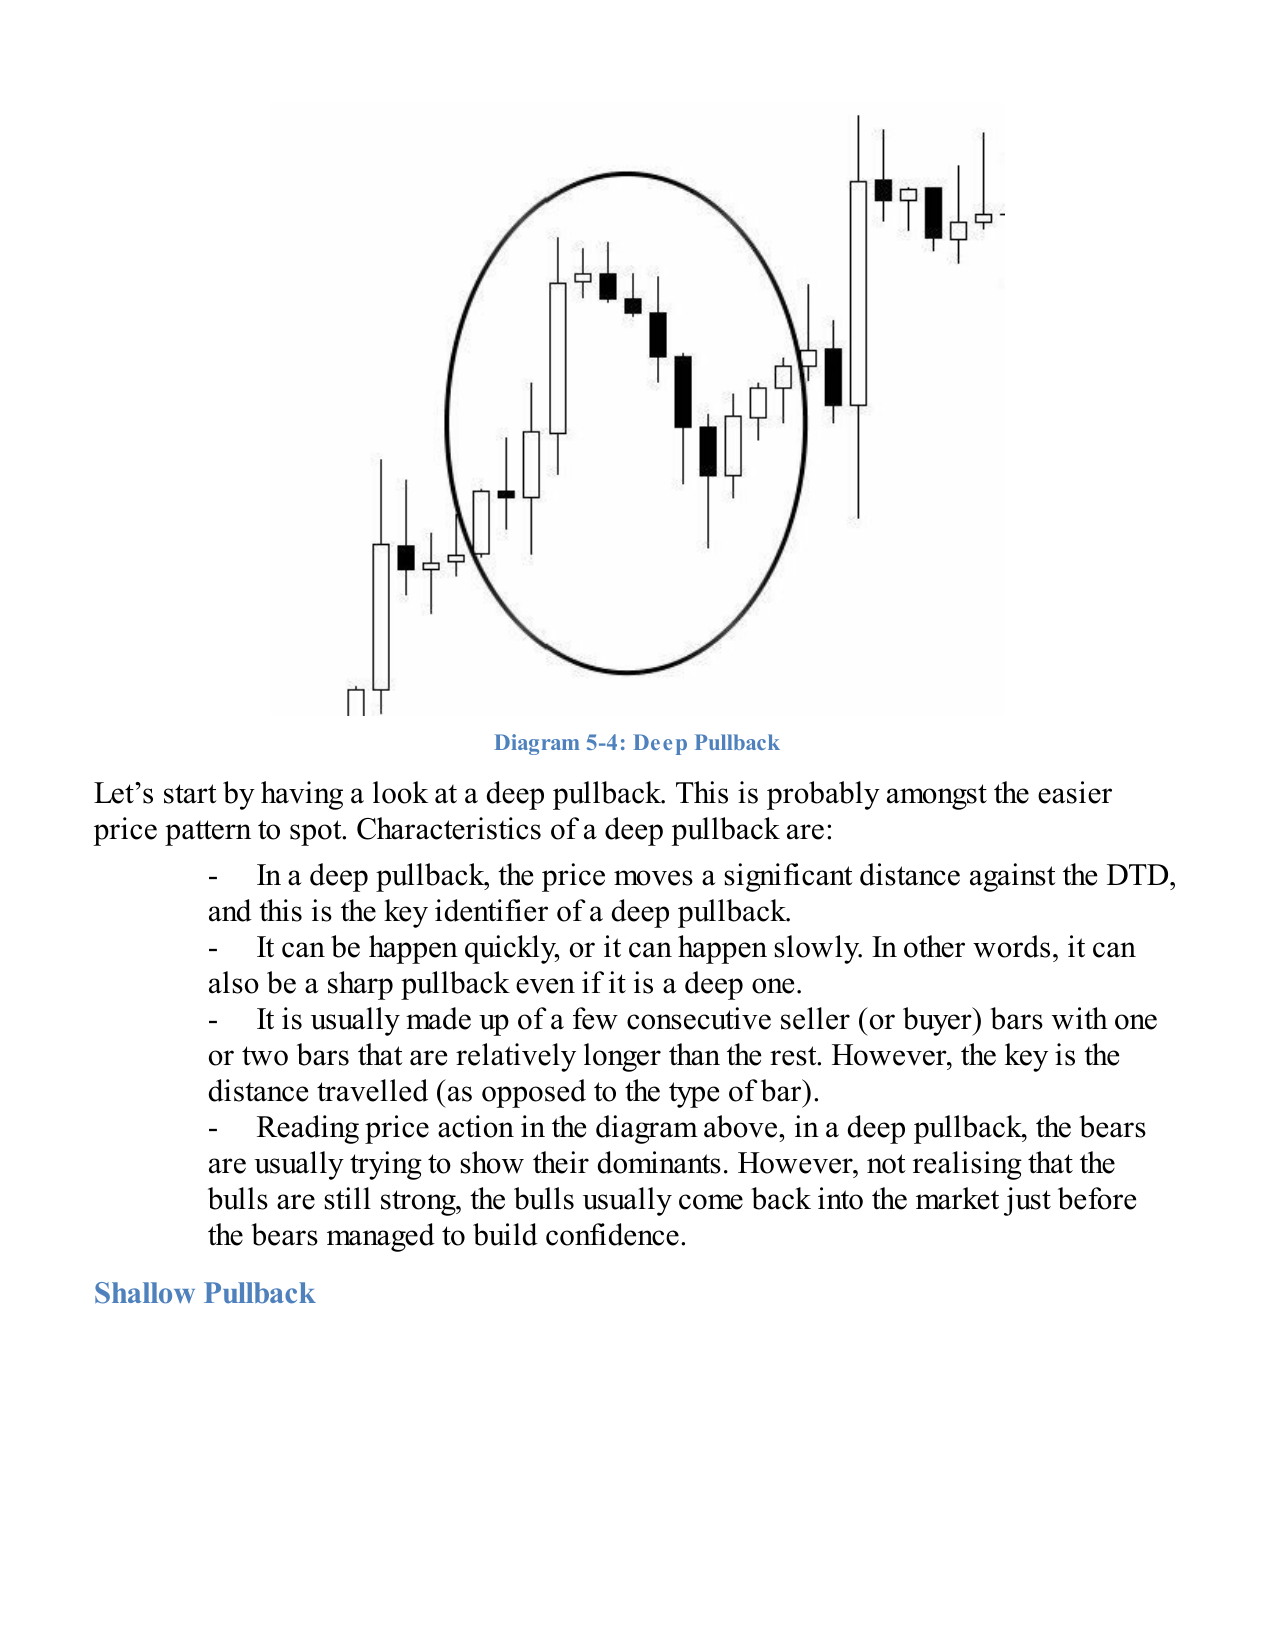
Deep Pullback
Price travels a significant distance against the DTD. Can indicate market exhaustion. Associated with Fib ratios of 61.8–76.4%. The continuation move is often weaker than after a shallow pullback.
Simple — Type C
Sharp Pullback
A very quick counter-trend move, often one or two bars. Speed is the key identifier. Smart traders treat it as a buying (or selling) opportunity at a temporarily cheaper price.
Simple — Type D
Flat Pullback
Price moves almost entirely sideways — minimal counter-trend movement. Signals an extremely strong, almost one-directional market. Big players are driving price before retail traders realise it.
Complex Pullbacks
Complex pullbacks enter a consolidation phase. They are harder to trade and frequently morph into reversal patterns. The advice from the framework is clear: when in doubt, stay out. Only simple pullbacks provide the clarity required for high-probability entries.
| Pattern | Characteristic | Signal |
|---|---|---|
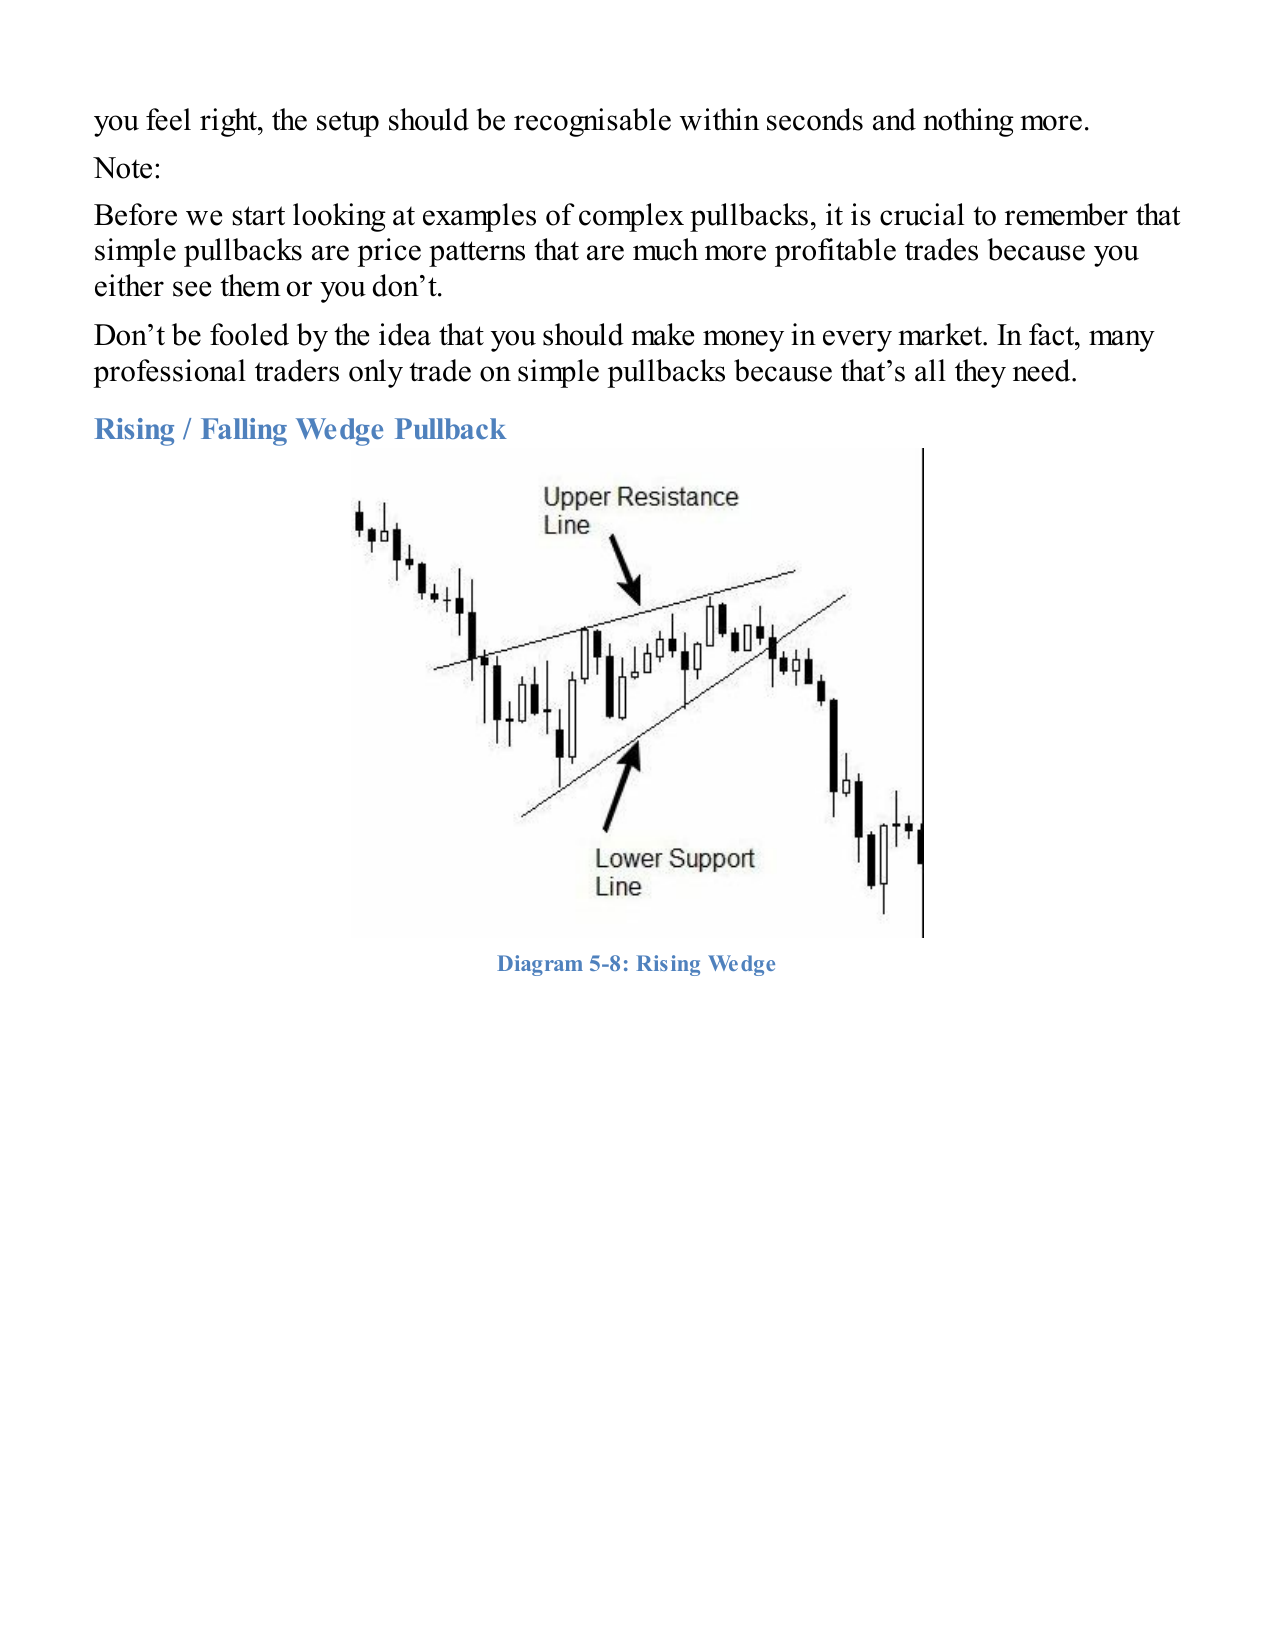
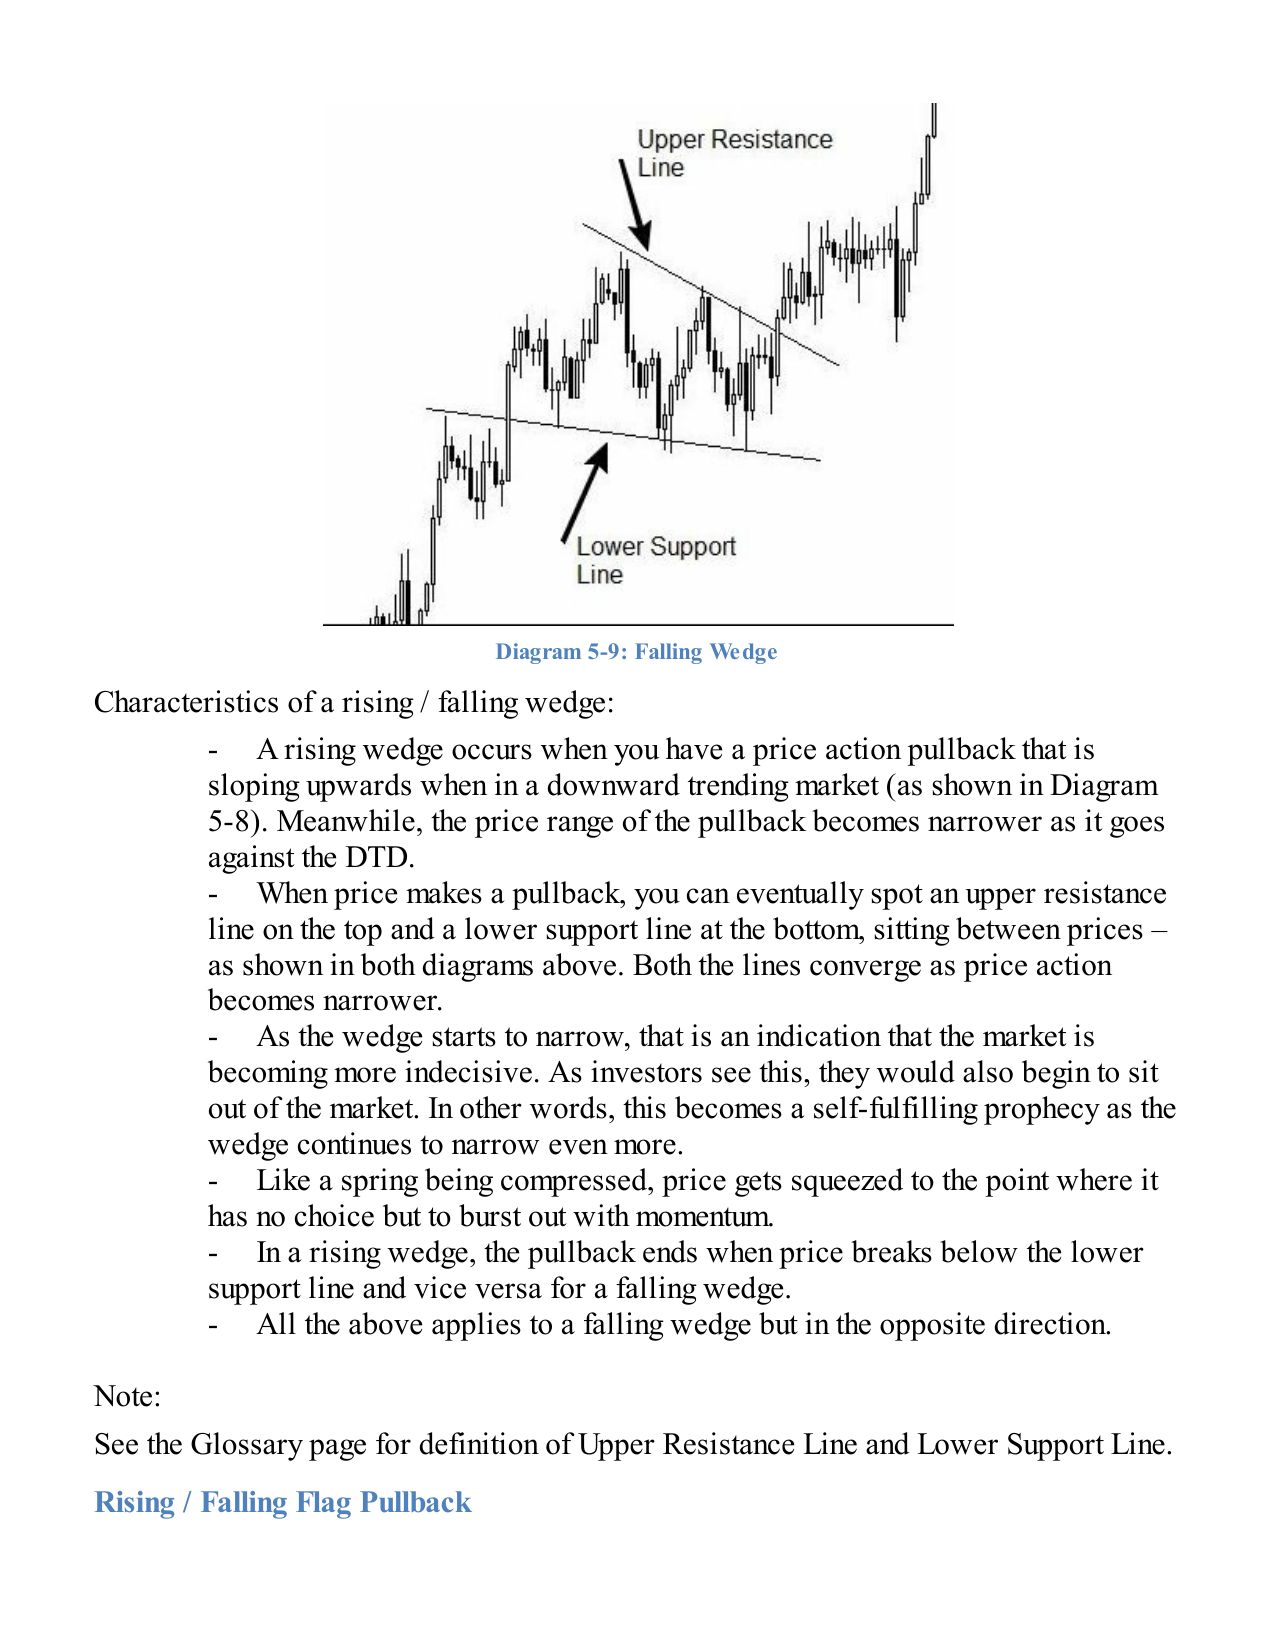
| Rising / Falling Wedge | Converging upper & lower boundary lines sloping against DTD | Watch Break of lower support line (rising) / upper resistance (falling) |
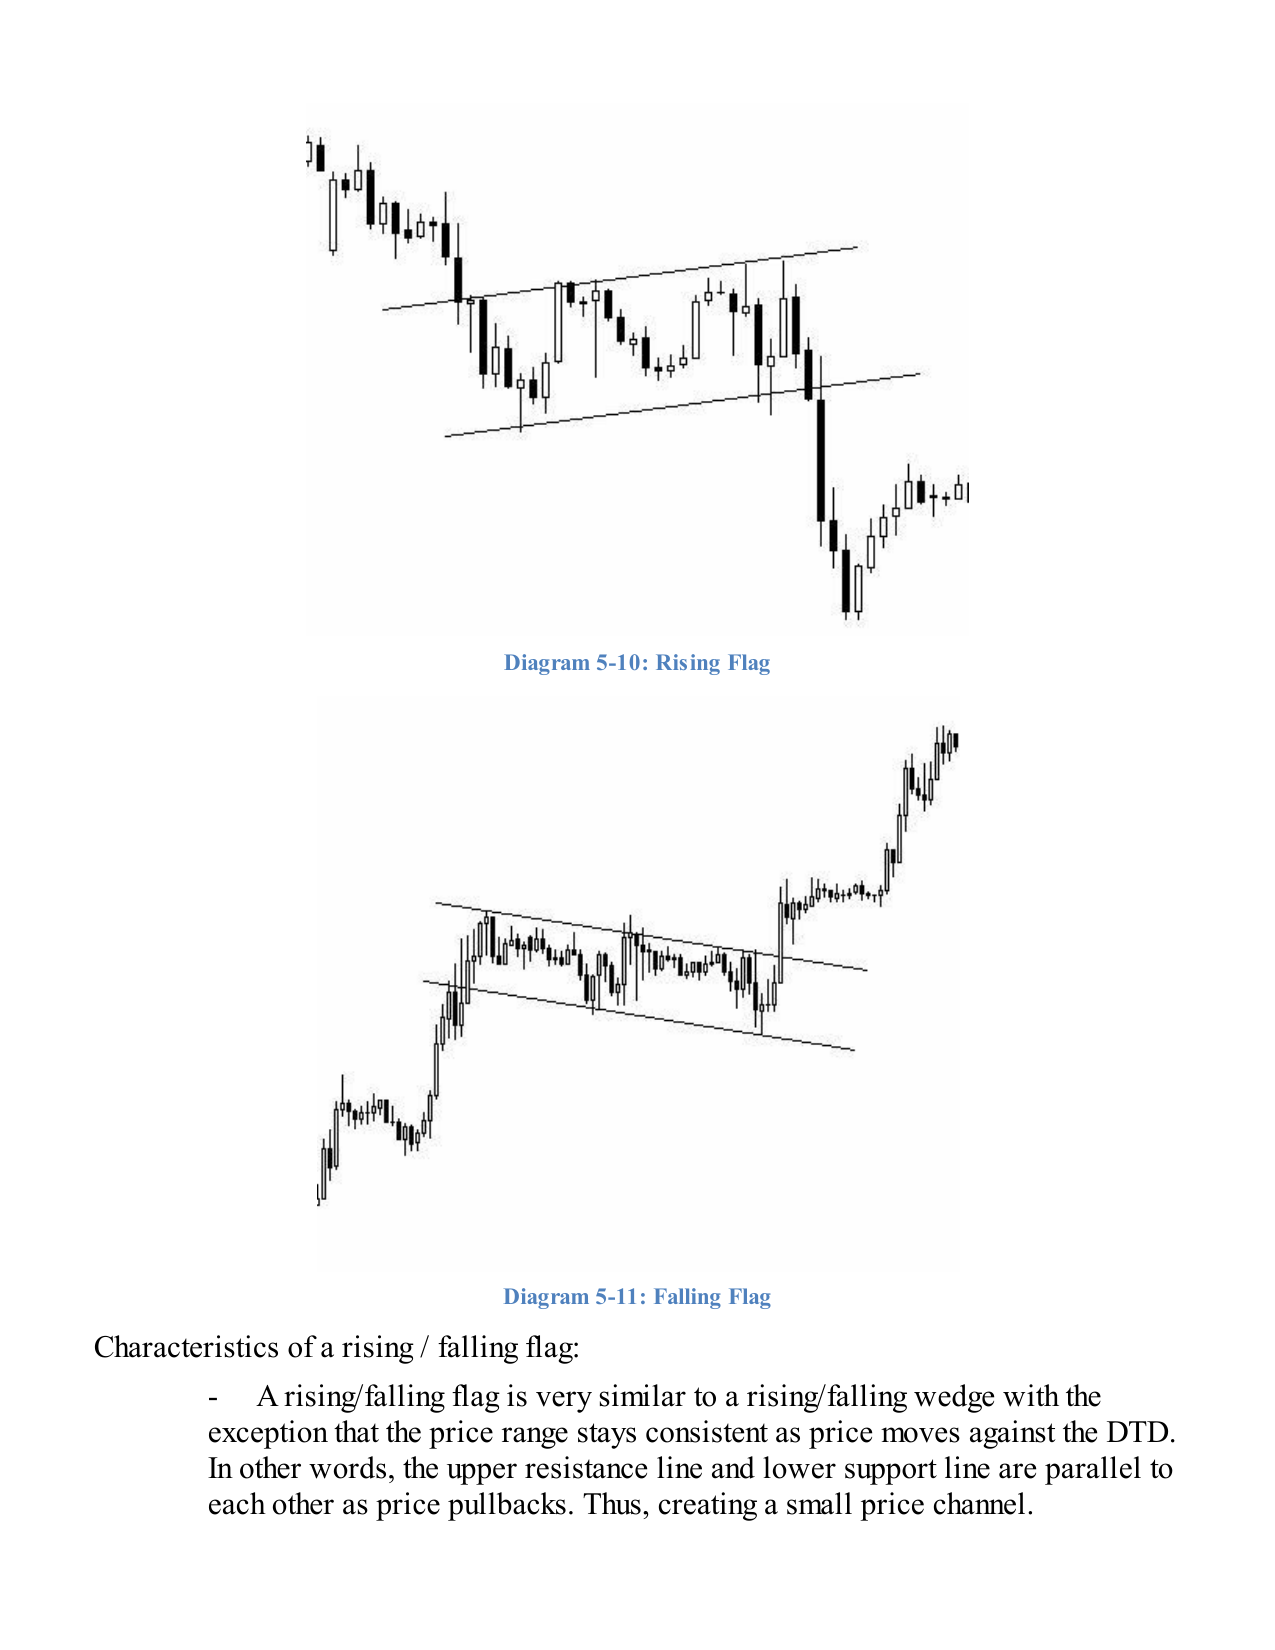
| Rising / Falling Flag | Parallel channel sloping against DTD | Watch Break out of the channel in DTD. Can become a reversal. |
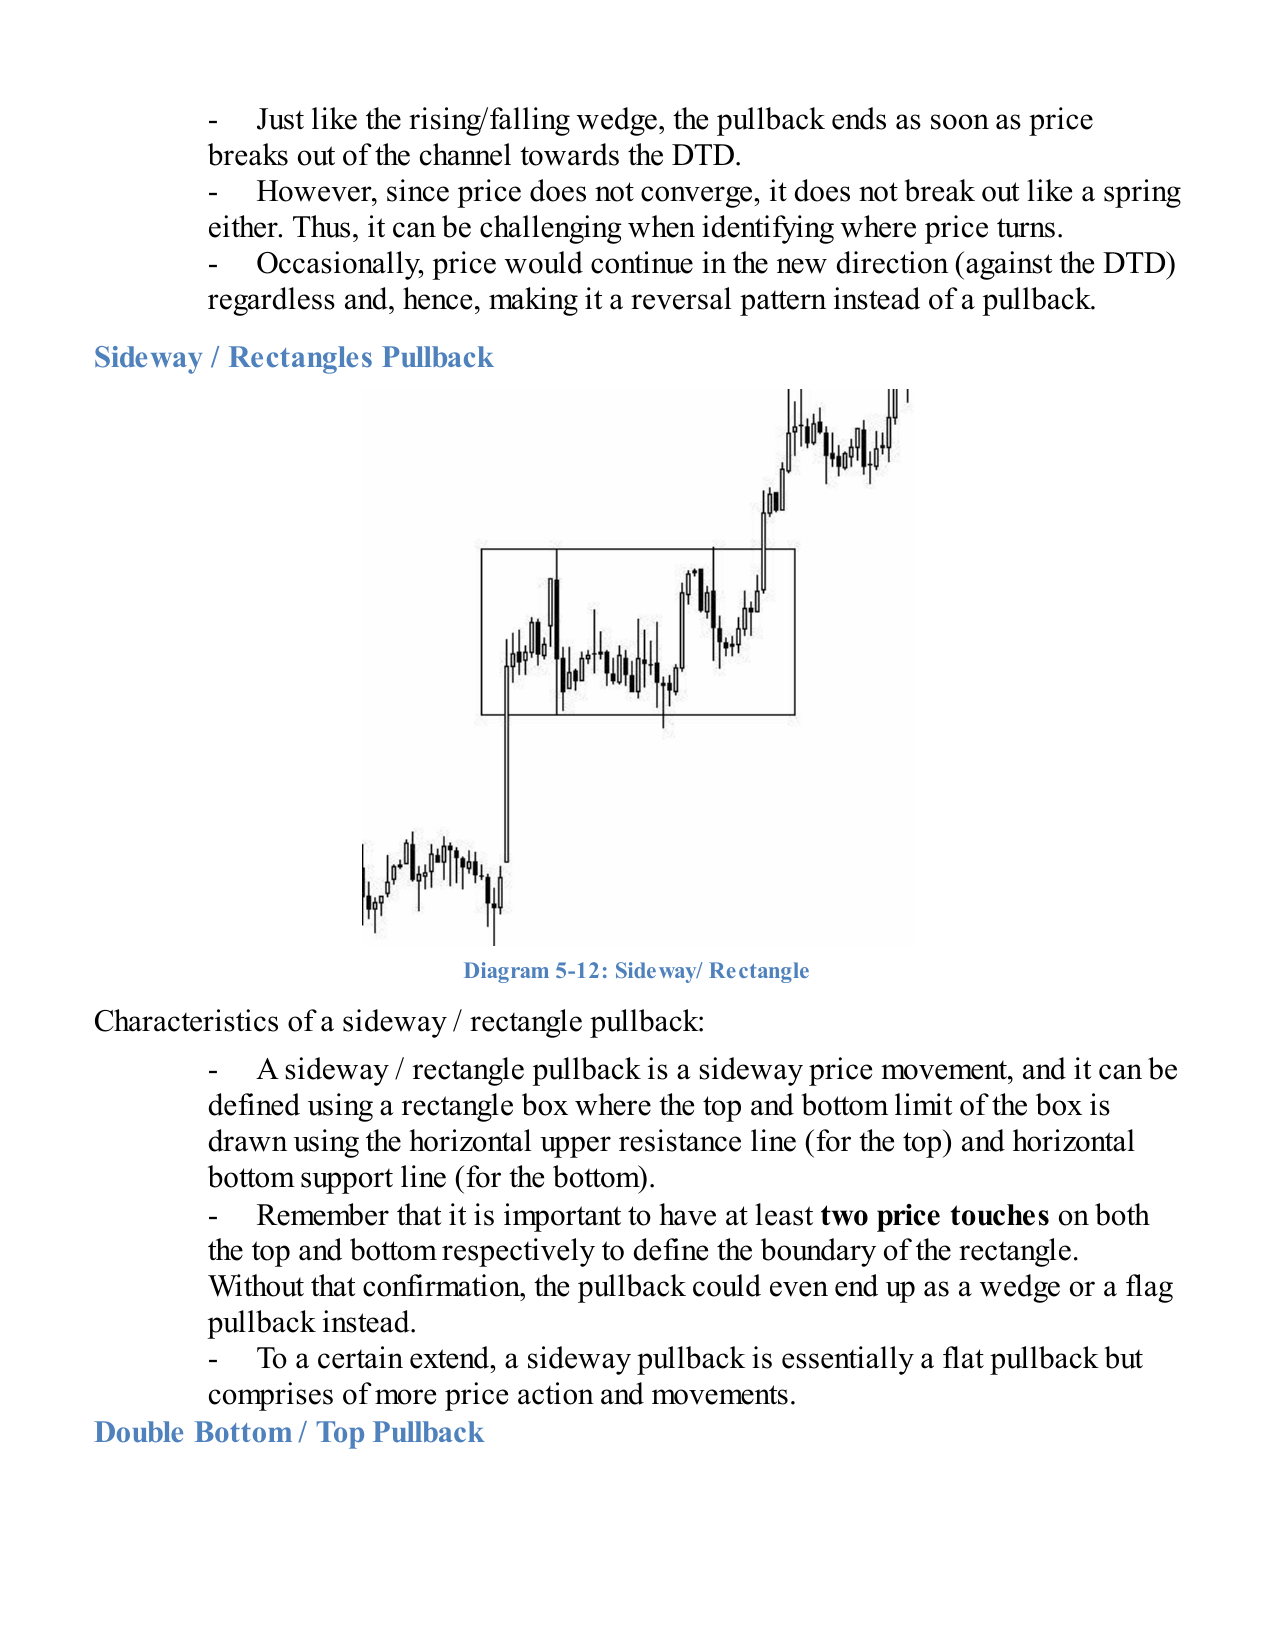
| Sideway / Rectangle | Horizontal consolidation box; 2+ touches top and bottom | Watch Breakout in DTD. Often treated as a flat pullback on a larger scale. |
| Double Bottom / Top | Price revisits same level twice before resuming DTD | Watch Common in continuation; also a classic reversal. Context determines signal. |
| Ascending / Descending Triangle | Converging lines; one horizontal, one sloping | Attractive Higher lows lead to a breakout. Risk: can break in either direction. |
| Pennant | Symmetrical converging triangle following a strong move | Watch Breakout timing is unpredictable. Can become a reversal. |
| Widening Wedge | Diverging lines; increasingly volatile swings | Caution Tug-of-war between buyers and sellers. Most dangerous for new traders. |
03 — Measurement
Measuring Pullbacks with Fibonacci
Fibonacci Retracement (Fib Ret) ratios identify price zones where a pullback is likely to reverse back into the DTD. They are not exact science — they are probability zones. The three key ratios are 38.2%, 50%, and 61.8%.
Indicative strength of trend continuation after pullback reaches each ratio level.
Fibonacci Rules
- Draw the Fib from the swing low (A) to swing high (B) in an uptrend — or from swing high to swing low in a downtrend.
- 23.6% and 38.2% are shallow pullbacks — expect strong continuation.
- 61.8% and 76.4% are deep pullbacks — expect weaker or exhausted continuation.
- Price often tests 50% before settling at 61.8%. Be patient.
- Fib levels are more reliable in trending markets. Use sparingly in ranging conditions.
04 — Risk Awareness
When Pullbacks Fail
A pullback fails when C breaks clearly beyond A — i.e., price does not resume the trend but instead breaks the prior structural extreme. This is not just a lost trade: it is critical market information. A convicted failed pullback signals the old trend has likely ended.
Outcomes After a Failed Pullback
Outcome 1
Sideways, then Resume
Market consolidates before continuing in the original trend direction. The pullback was a complex pattern. Wait for the next clear signal before re-entering.
Outcome 2
Sideways, then Reverse
Market consolidates before breaking in a new direction. Look for a new higher high / lower low to confirm direction. Patience required.
Outcome 3
Immediate Reversal
Market moves directly into a new trend. This is the scenario many traders expect but is not guaranteed. Confirmation is required before entry.
The Failed Failed Pullback
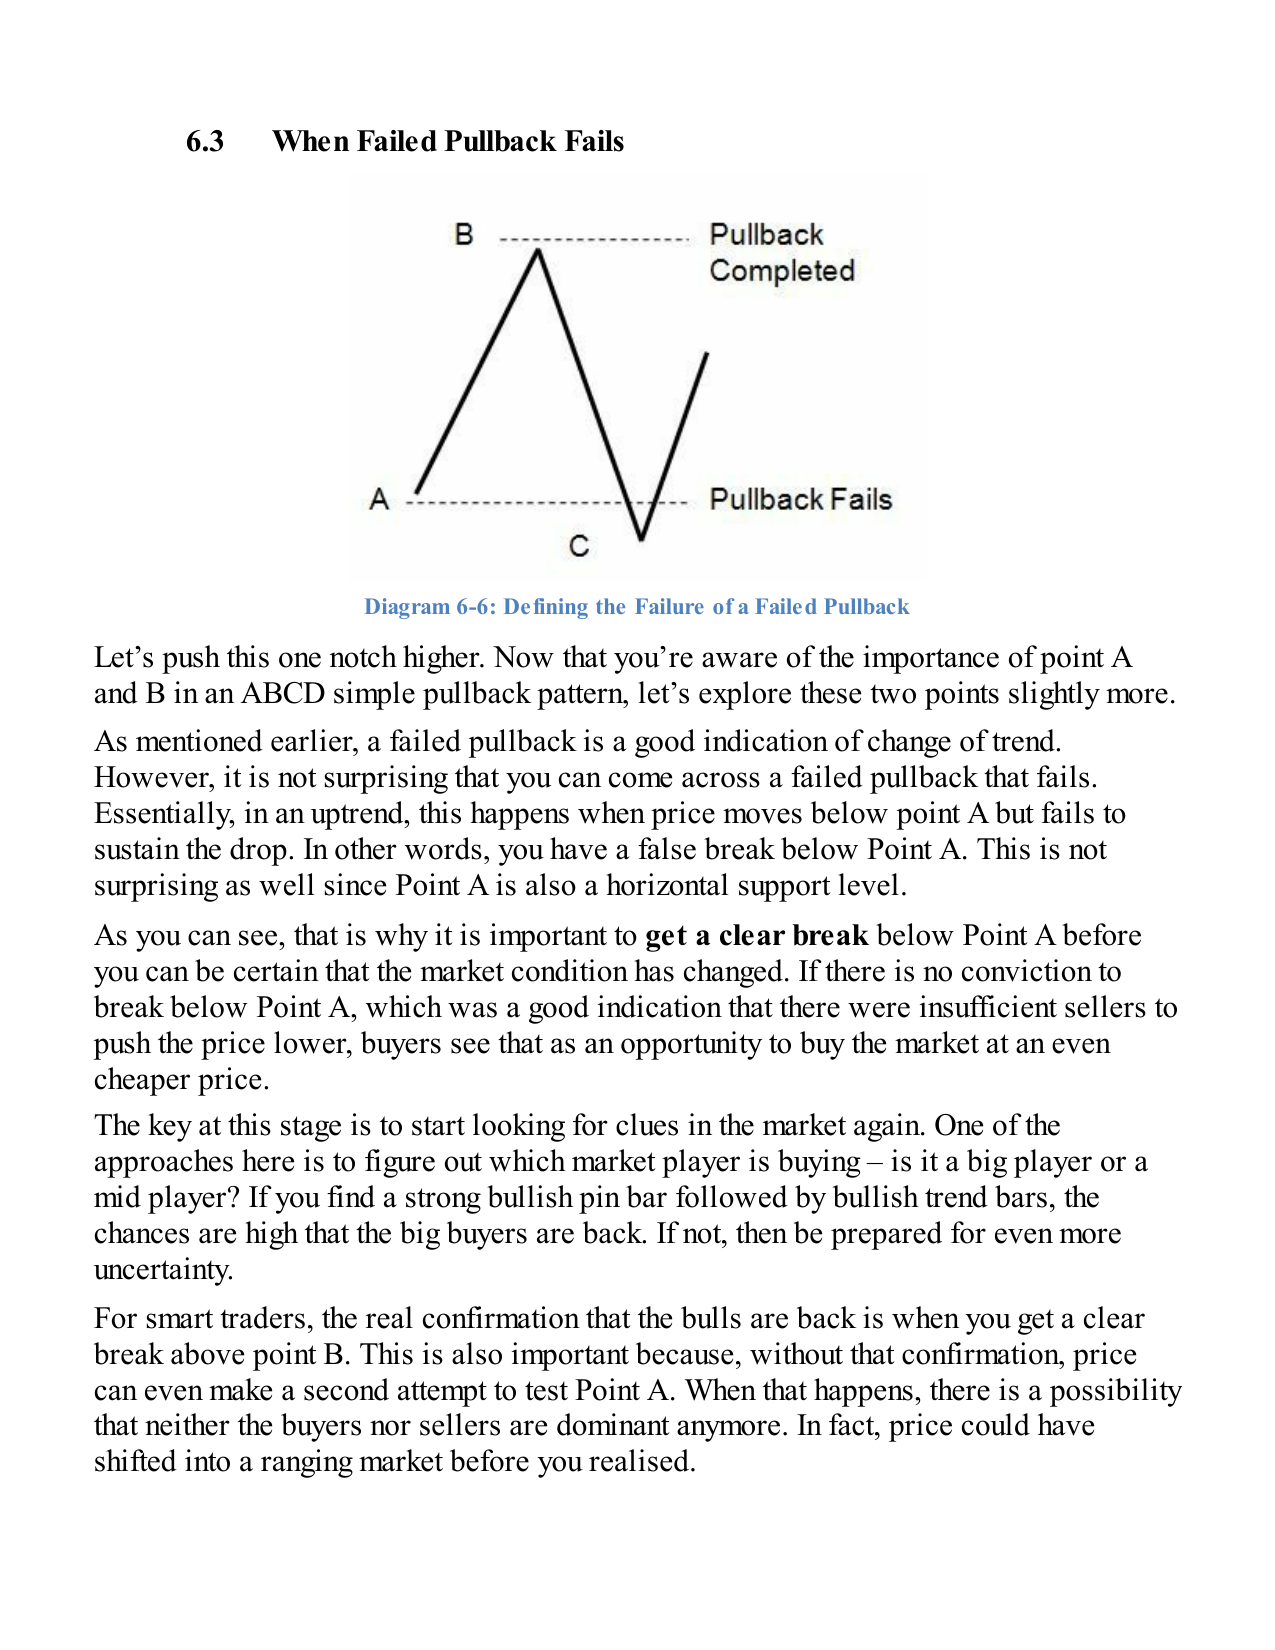
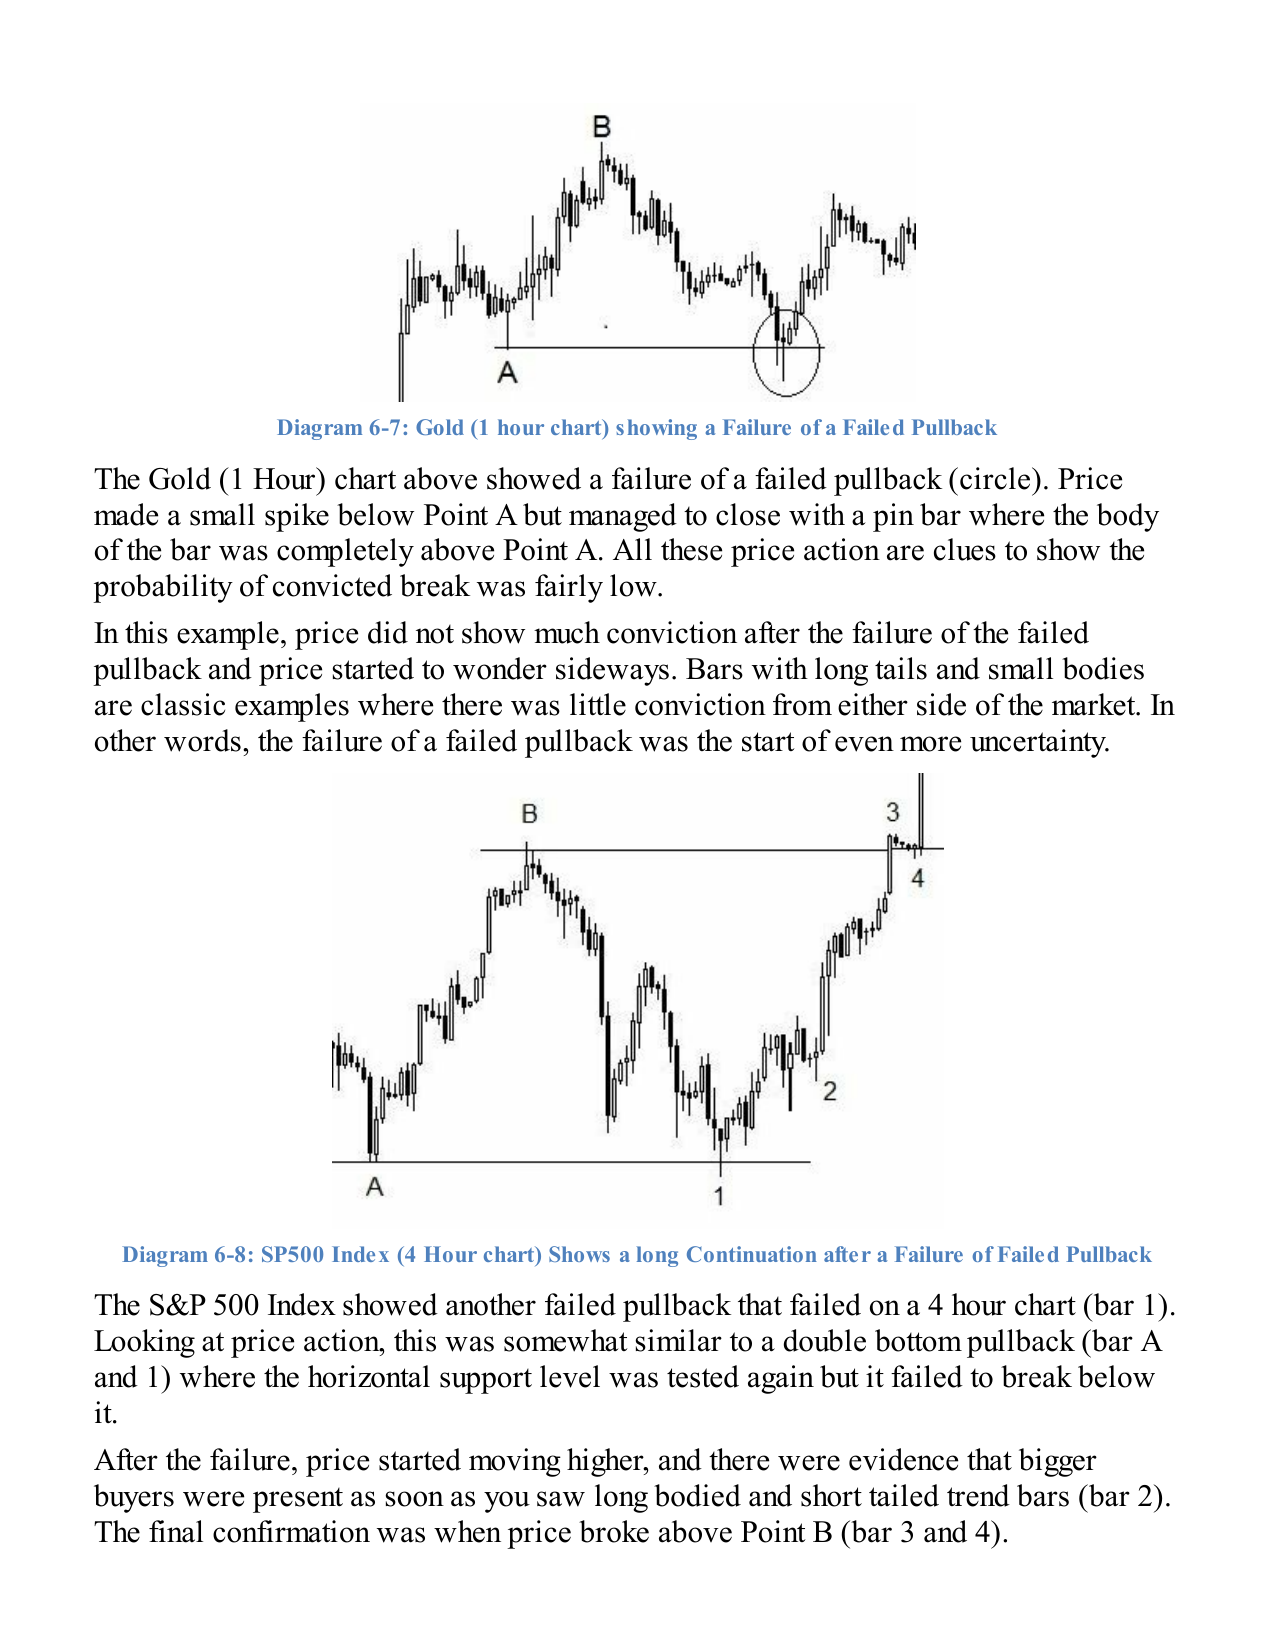
A false break below point A (in an uptrend) — where price spikes below A but quickly closes back above it — is a failed failed pullback. This pattern, often appearing as a bullish pin bar, indicates insufficient sellers and is a powerful signal that buyers are re-entering at an even lower price.
Confirmation of trend resumption requires a clear break above point B. Until then, the market may enter a ranging phase or make a second test of the lows.
Final Test of the Extremes
Near market tops and bottoms, buyers and sellers intensify their battle. The Final Test is the last attempt by the dominant side to push further before control changes. The four common scenarios are:
| Pattern | What It Means | Action |
|---|---|---|
| Lower High + Lower Low | Classic failed pullback; strong reversal signal | Short bias |
| Double Top + Lower Low | Early exhaustion signal; sellers gaining control | Short bias |
| Higher High + Lower Low | Bull trap; sellers aggressively entered at the new HH | Short bias |
| Higher High + Higher Low | Not the final test; trend continues. More tests coming. | Stay long |
05 — Execution
Clues for a Successful Pullback Trade
Trading is not prediction — it is probability stacking. Before entering any pullback trade, gather as many independent clues as possible. The more clues that align, the higher the probability of a successful trade.
Shallow pullbacks (23.6–38.2% Fib) signal a one-sided, strong market and are associated with longer, more forceful continuation moves. Deep pullbacks (61.8%+) often indicate waning momentum; the continuation, if any, is likely weaker. Use the Fib Ret tool as a mechanical reference point, not an absolute rule.
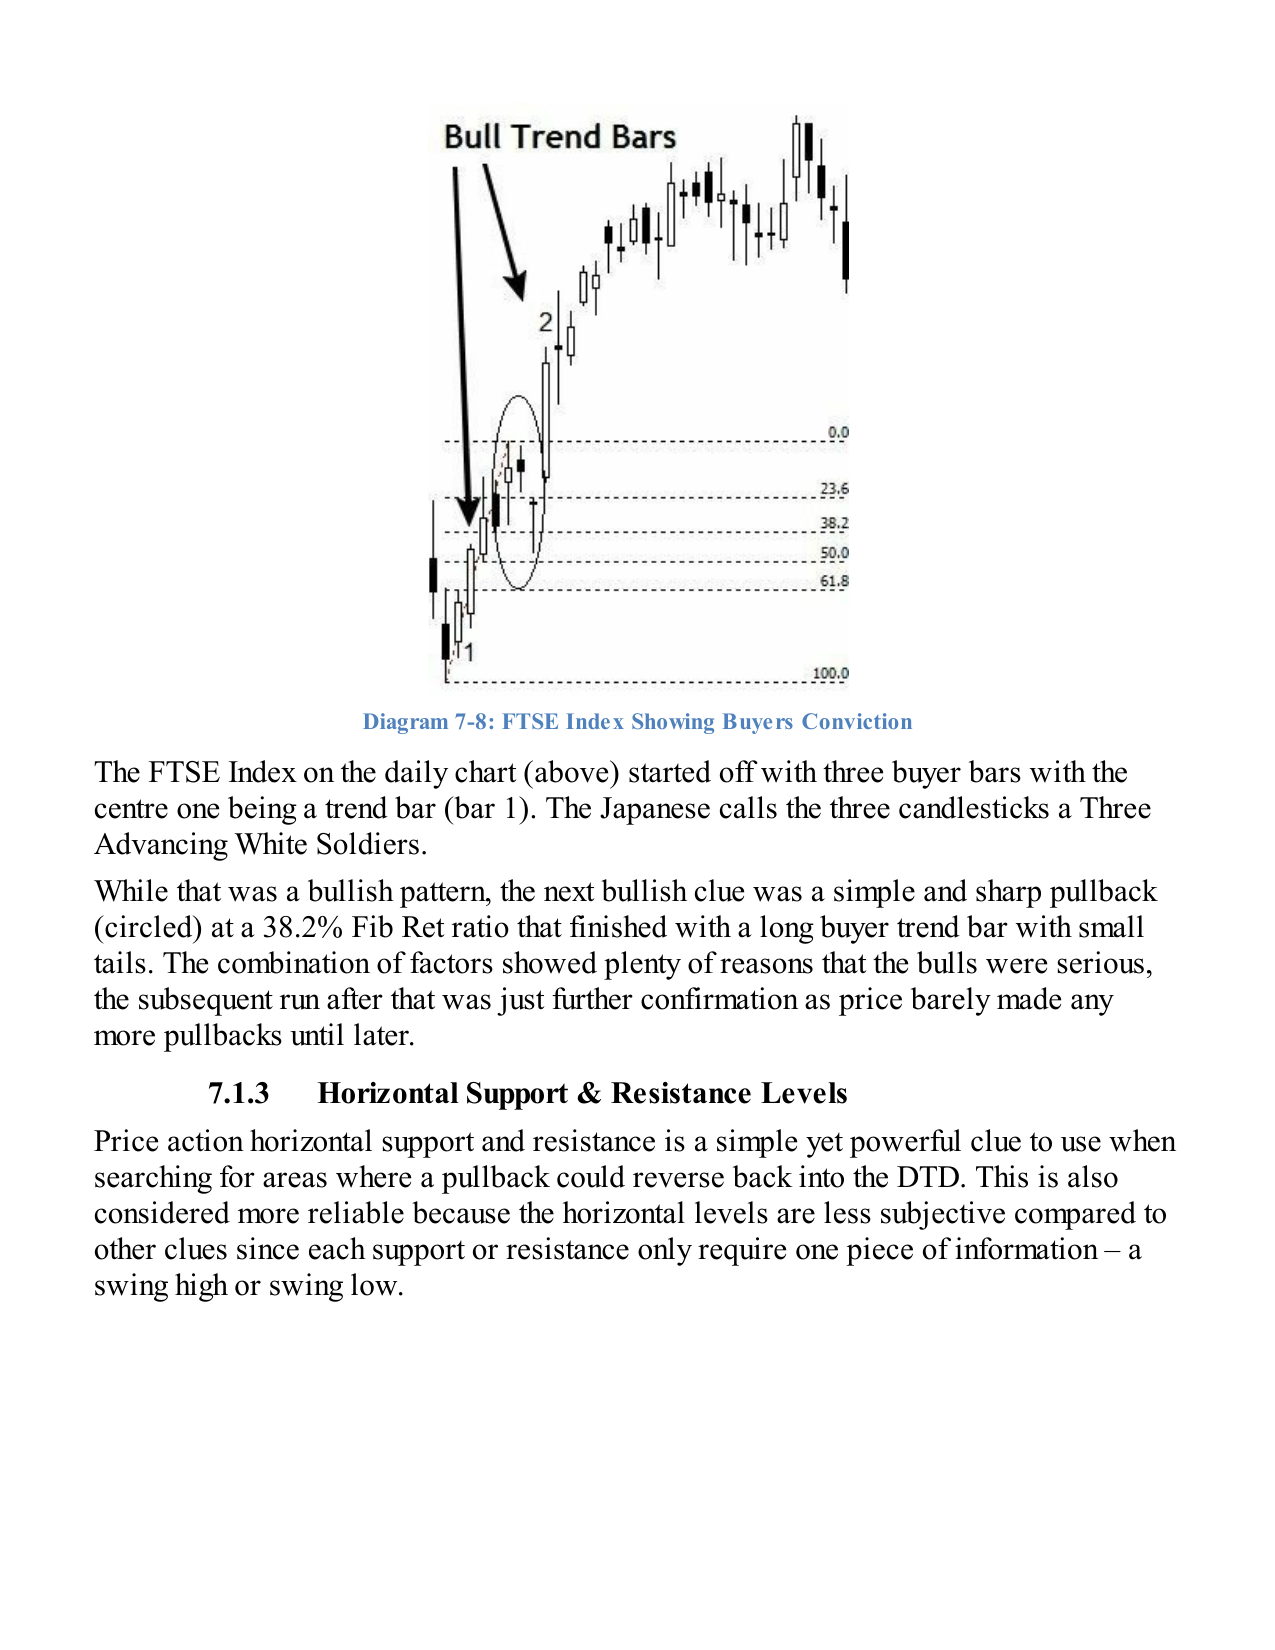
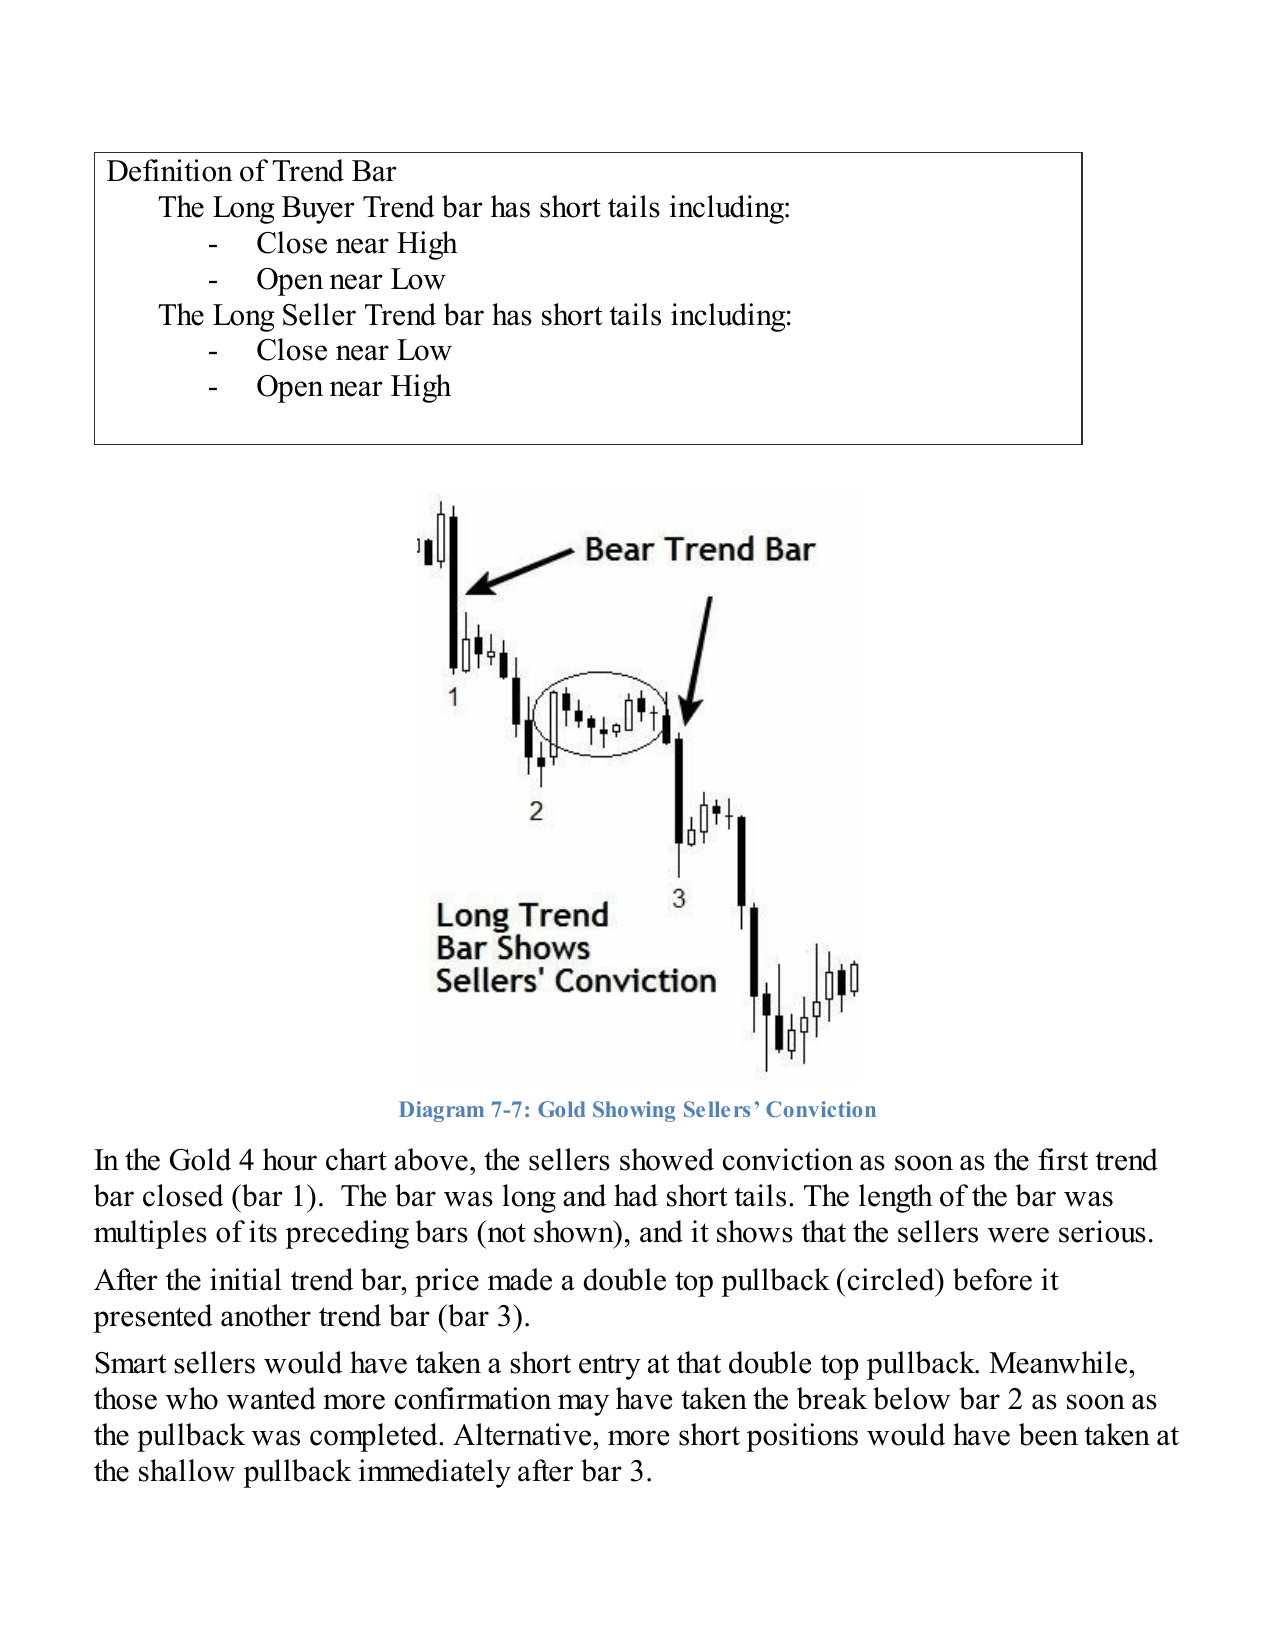
A long-bodied bar with minimal tails — closing near its high (bullish) or near its low (bearish) — signals that large institutional players are driving the market. When a trend bar appears at the start of a move, it is a strong indication of sustained momentum. When it appears at the end of a run, it can indicate exhaustion. Look for trend bars to confirm both the initial move and the pullback completion.
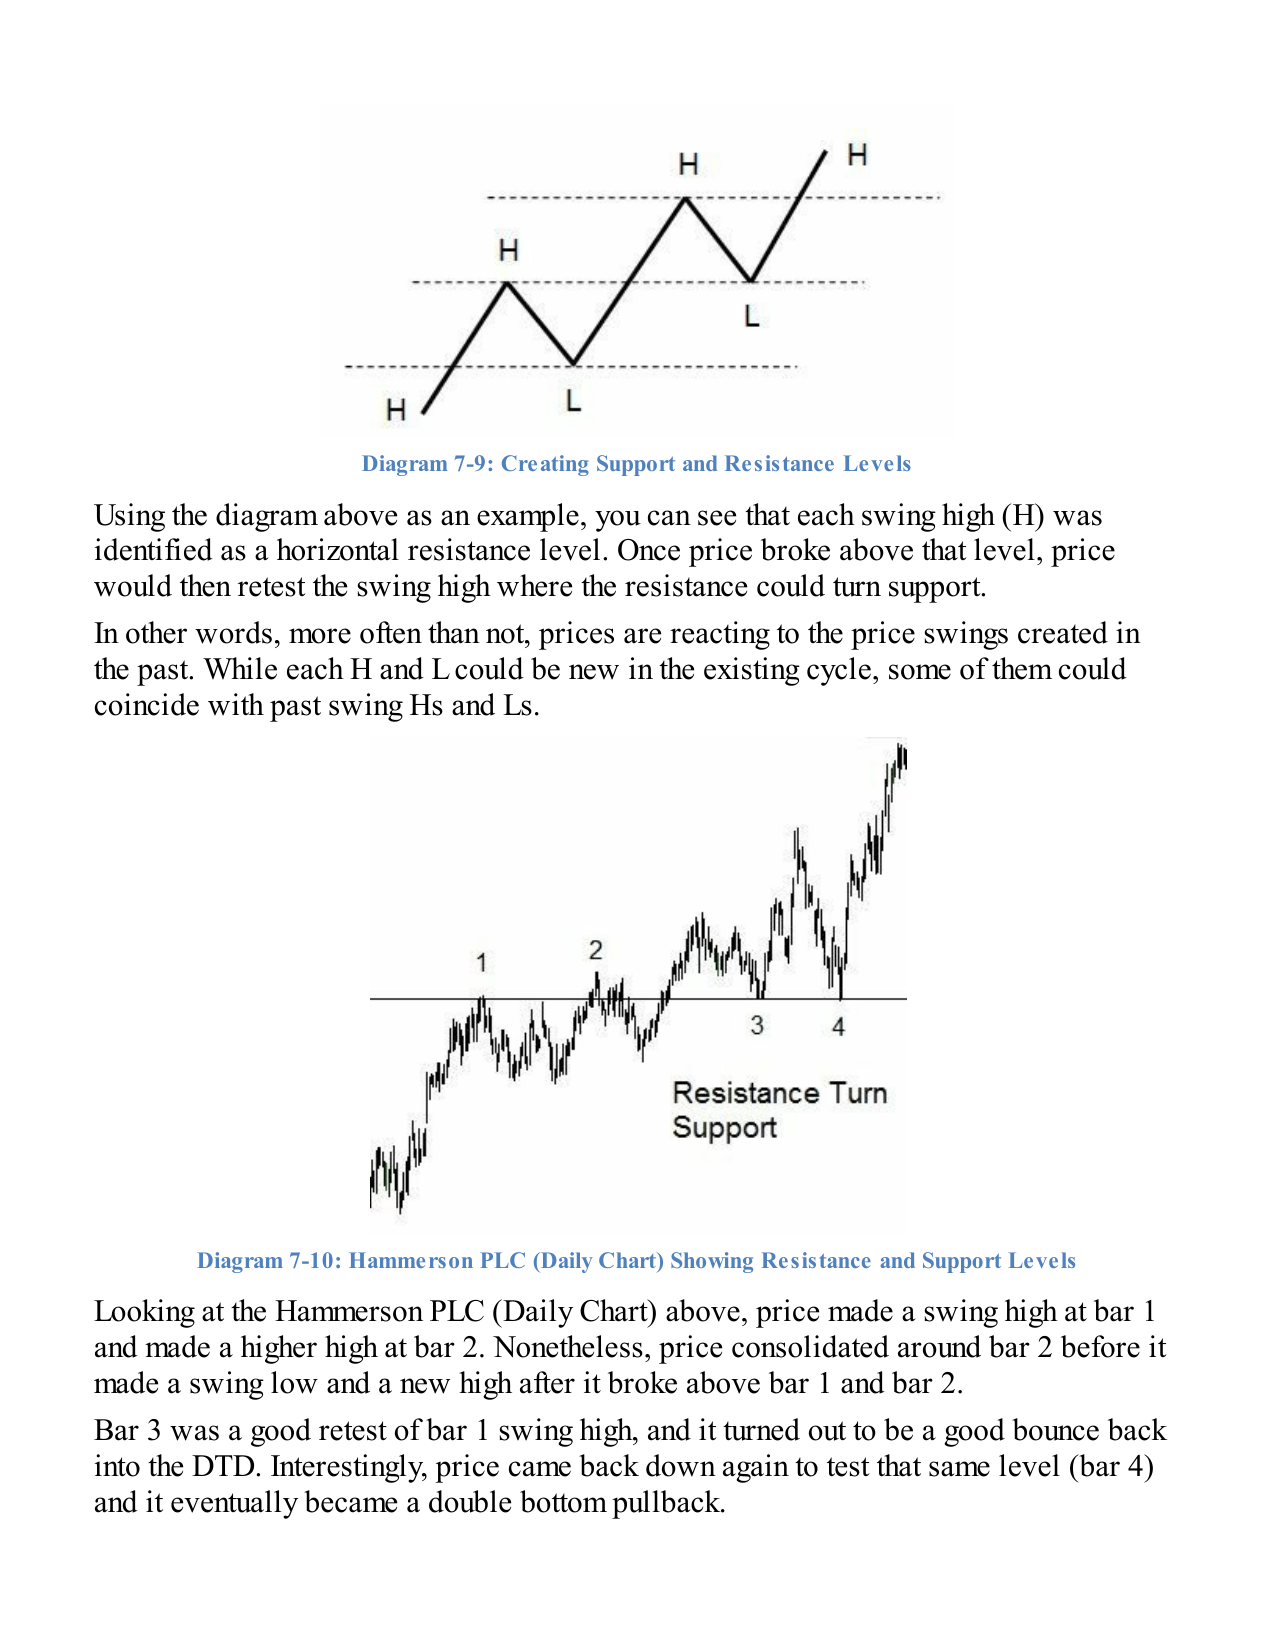
Price reacts to prior swing highs and swing lows. Old resistance becomes support after a breakout (and vice versa). A pullback that terminates exactly at a key horizontal level — the more times price has respected that level, the better — dramatically increases the probability of a successful with-trend re-entry. Two prior touches are the minimum requirement to consider a level valid.
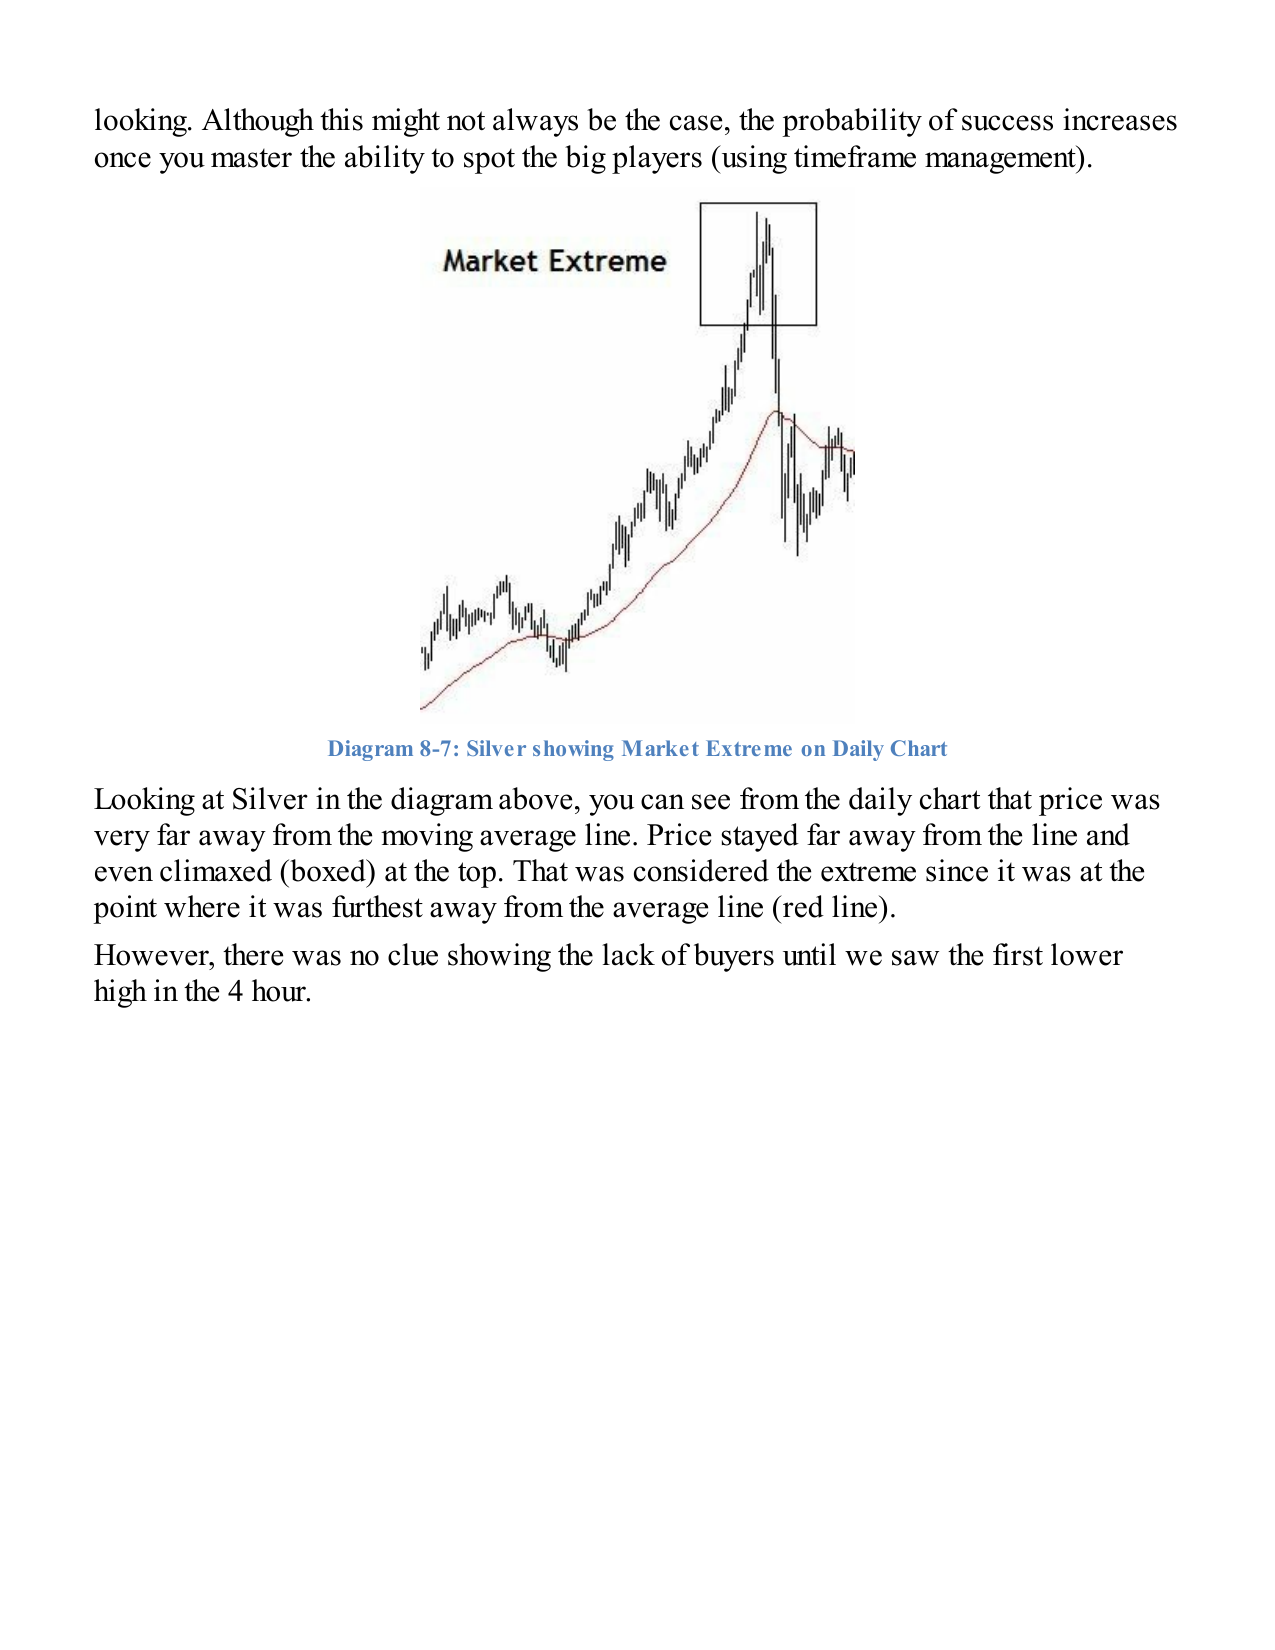
Market players operate on different timeframes. Big players (central banks, major institutions) drive long-term trends via the daily and weekly charts. Mid players (hedge funds, market makers) may manipulate intraday conditions during consolidation periods. Small players (retail) have minimal market impact. Always check the next higher timeframe for overall bias before committing to a trade on a lower timeframe. For example: check the 60-minute chart when trading a 15-minute chart; check the daily chart when trading a 4-hour chart.
A trending market often forms a price channel defined by an upper resistance line and a lower support line. Pullbacks that terminate near the channel's boundary — in the direction of the trend — are high-probability entries, as the channel's boundaries act as dynamic support or resistance. A break of the channel boundary is an early warning that the trend may be changing.
06 — The Premium Setup
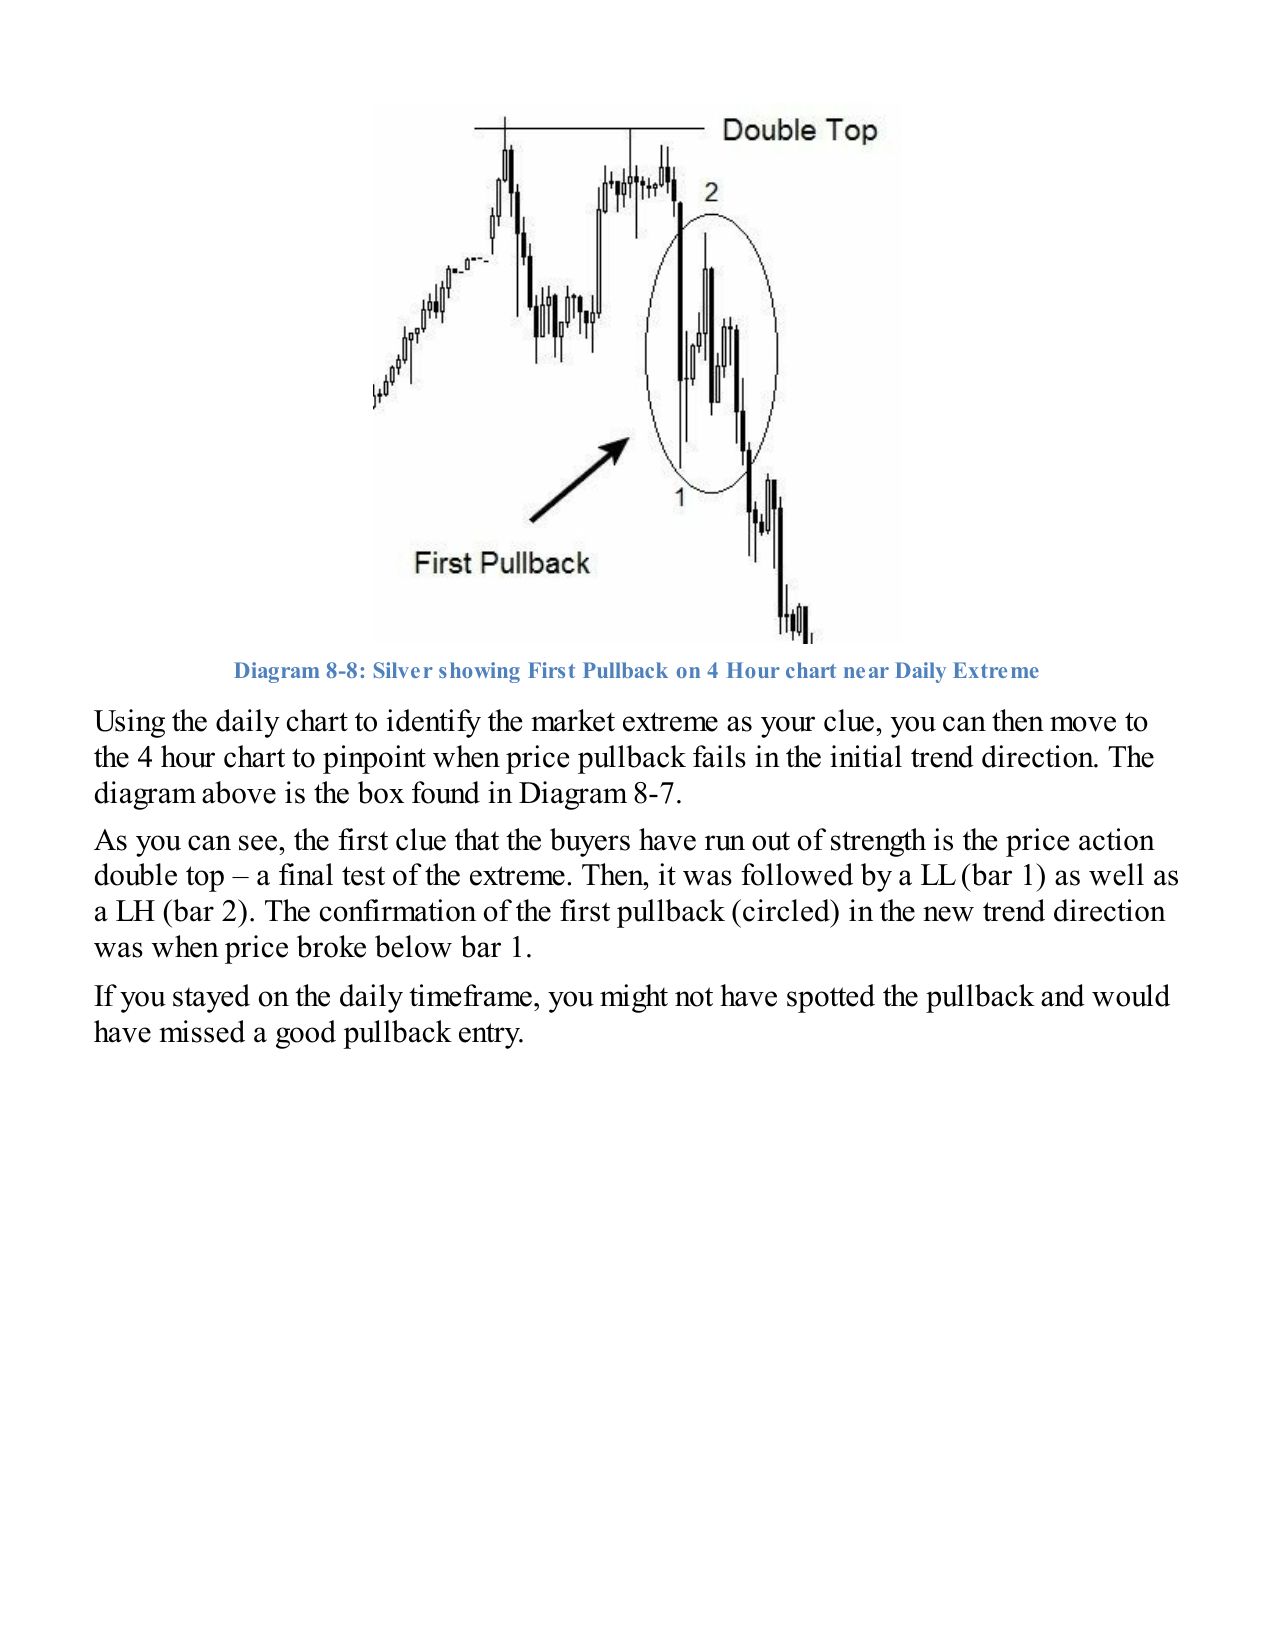
The First Pullback: The Best Entry
The first pullback is the first with-trend entry immediately after price has reversed from the old trend. It is not a reversal trade — it is a trend-following trade taken at the earliest possible stage of the new trend, when risk is lowest and reward is highest.
How to Identify the First Pullback
Identify the Old Trend's Final Test
Look for a lower high (in an uptrend) or higher low (in a downtrend) — this signals that the dominant side is losing control. The trend bar at the extreme should show signs of exhaustion (long tails, small body).
Confirm a Convicted Failed Pullback
Price must clearly break the prior structural extreme (point A) with a strong trend bar in the new direction. Small, tentative breaks are insufficient — look for a long-bodied bar with minimal tails closing decisively beyond point A.
Wait for the First Pullback (New BC)
After the break, price will temporarily retrace. This is the pullback in the new direction. The pullback ends when price forms a new lower high (in a downtrend) or higher low (in an uptrend) relative to the breakout bar.
Enter on Confirmation (New D Beyond New B)
The first pullback is complete — and the entry is triggered — when price breaks beyond the low of the breakout move (or above the high, in an uptrend). This is the new D exceeding the new B in the ABCD pattern.
Combine Clues for Higher Probability
The ideal first pullback entry combines: (a) a convicted failed pullback with trend bars, (b) alignment with a market extreme on a higher timeframe, (c) a recognisable reversal pattern (double top/bottom, H&S, range breakout), and (d) the retest of a key horizontal level as the neckline. The more clues present, the better.
Reversal Patterns That Signal First Pullbacks
| Pattern | First Pullback Signal | Confirmation |
|---|---|---|
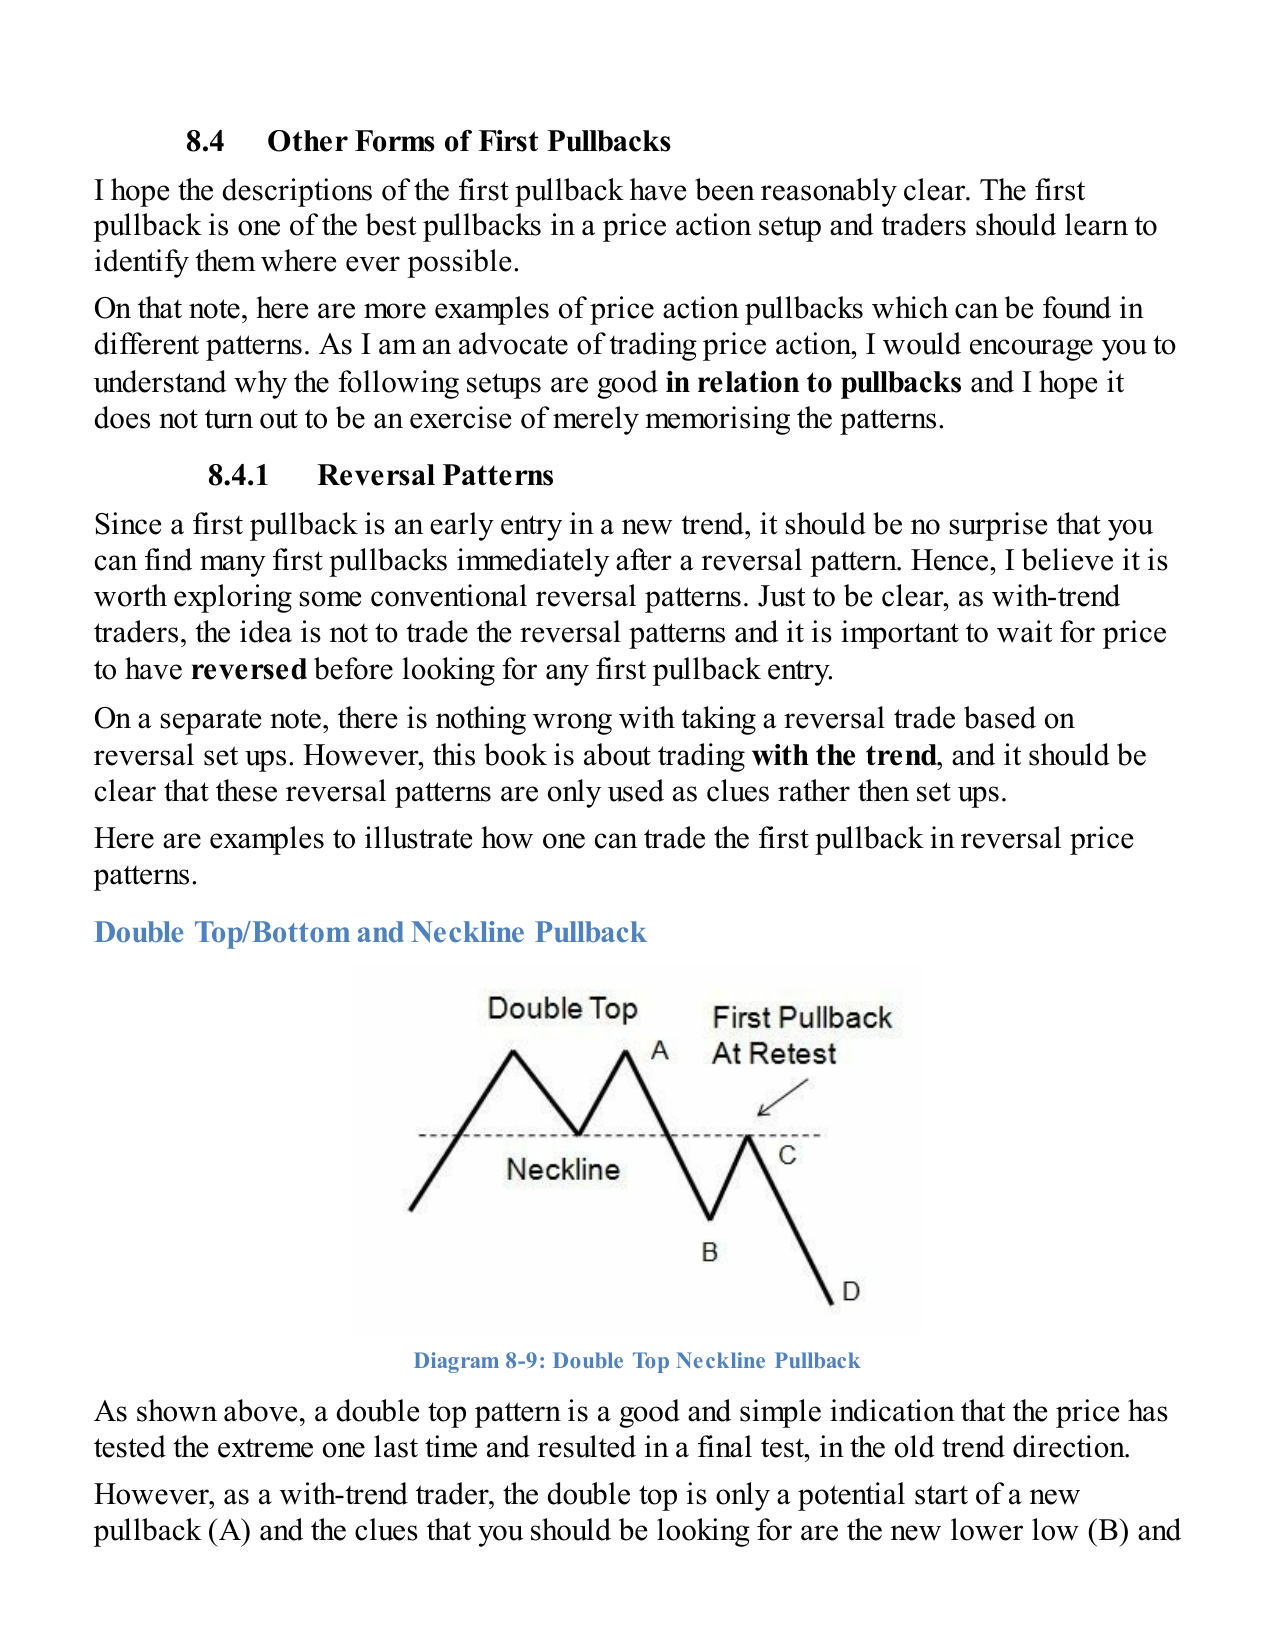
| Double Top / Bottom | Second top (or bottom) fails to make a new extreme | Break of neckline (prior low / high) then a retest |
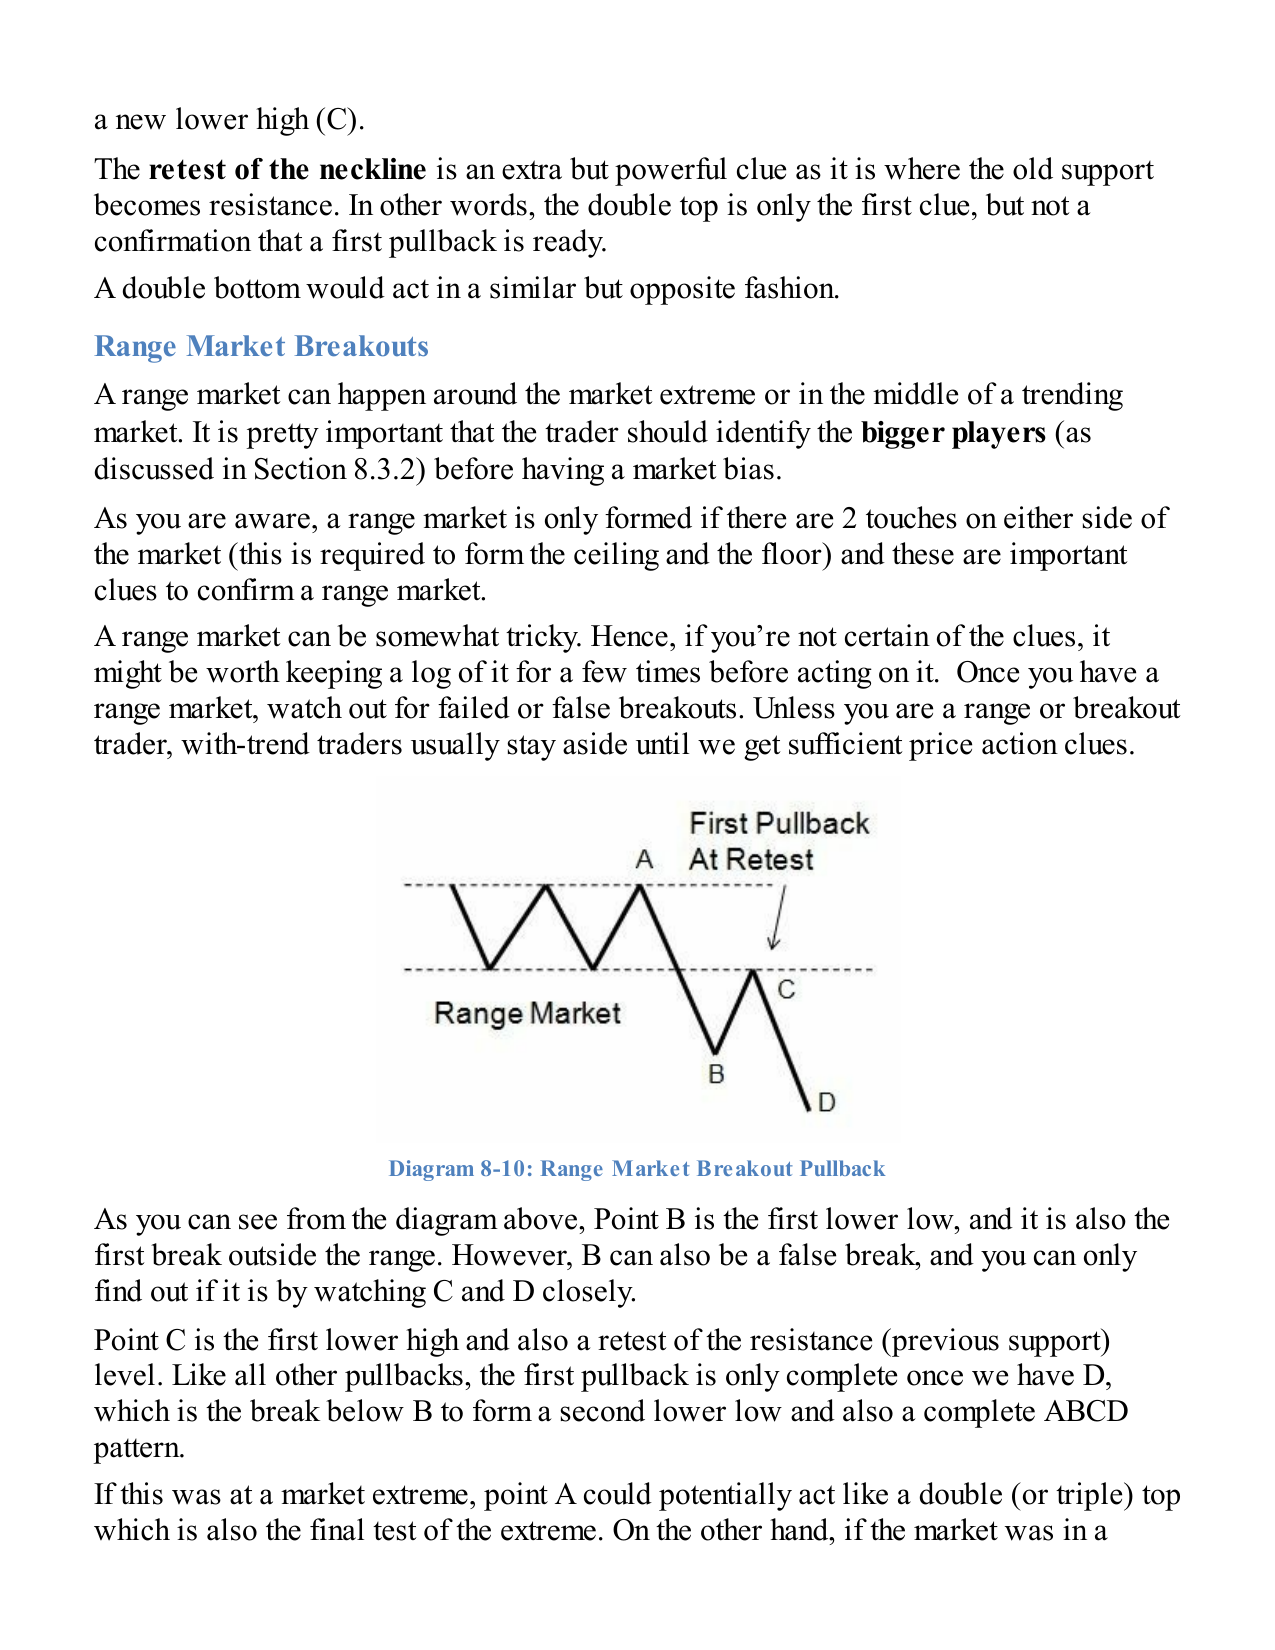
| Range Breakout | Price breaks the floor or ceiling of the range | False breakout test, then second break & retest of the boundary |
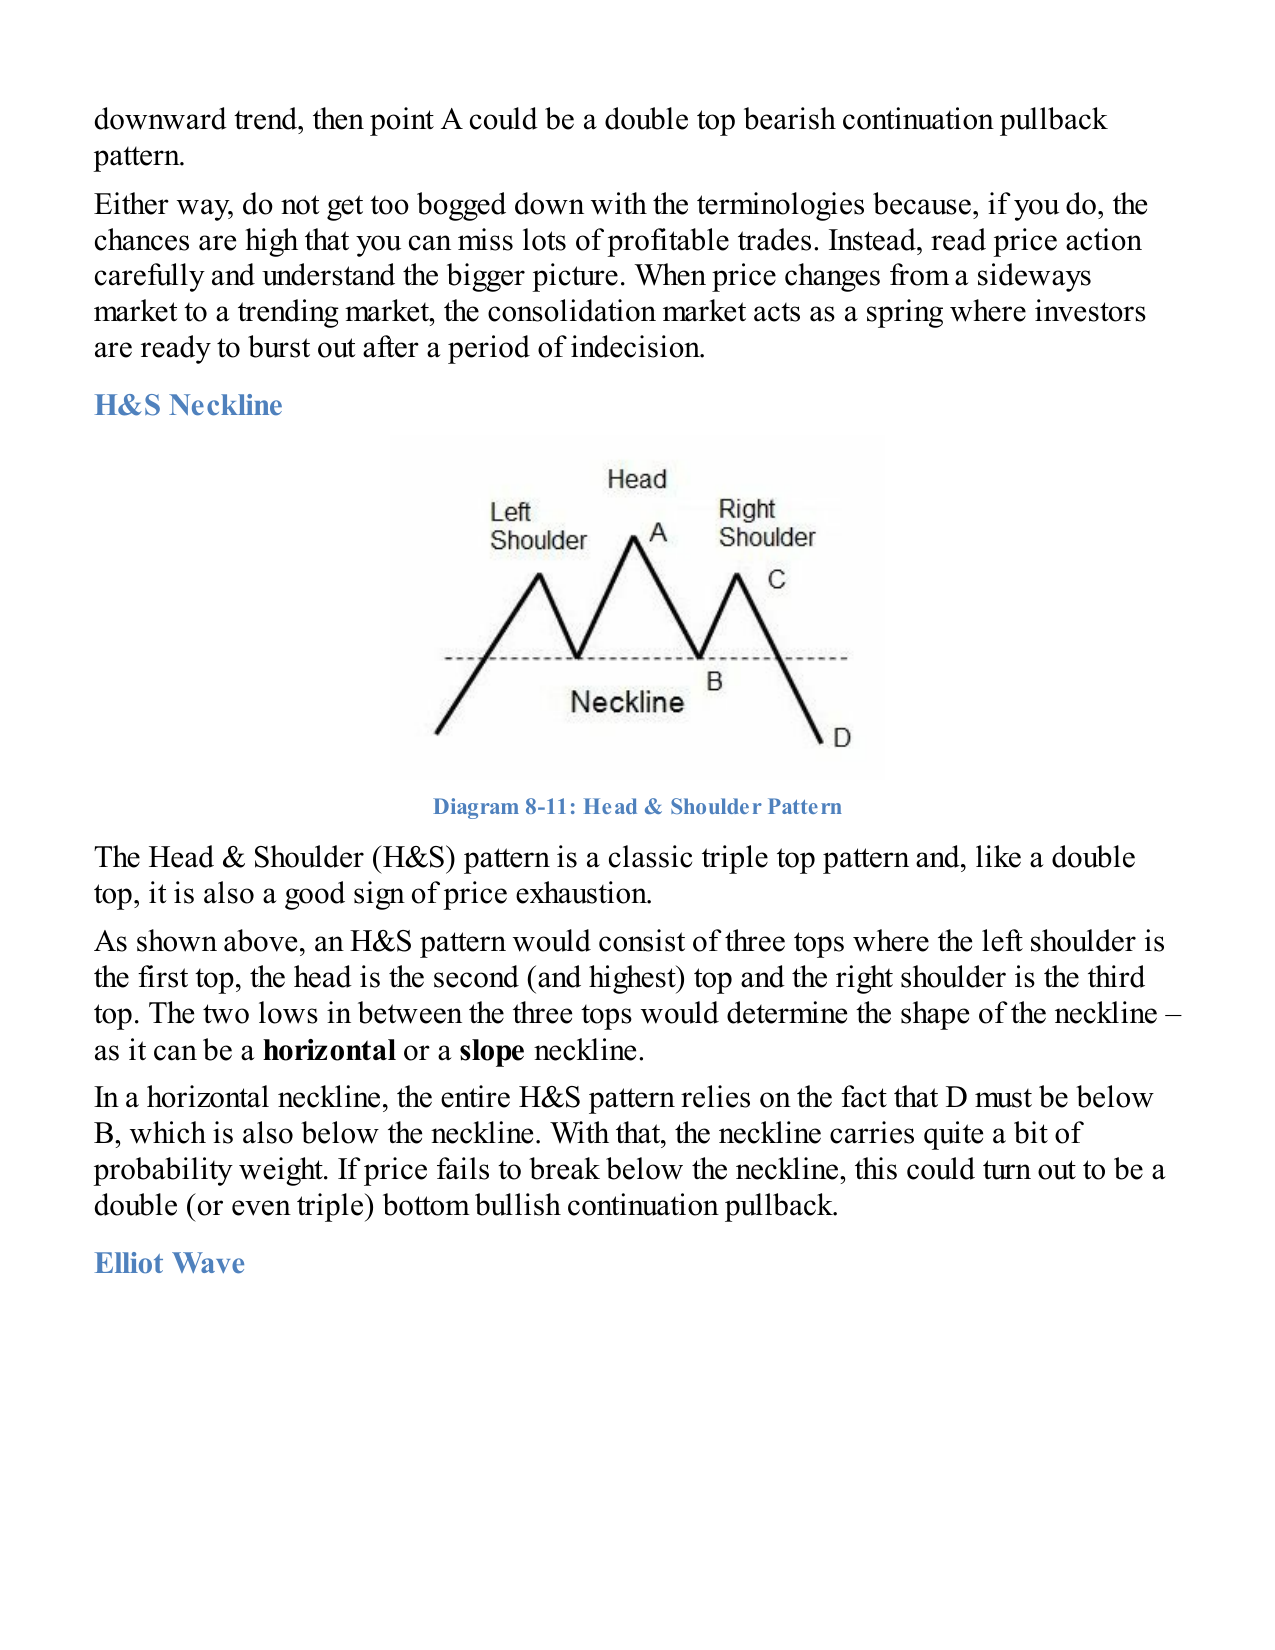
| Head & Shoulders | Right shoulder forms at a lower high | Break below the neckline, then retest of neckline as resistance |
| Elliott Wave | Wave 2 completes (end of corrective wave in new impulse) | Wave 3 commencement — the longest and most profitable wave |
First Pullback Checklist
- ✓ Higher timeframe shows a price extreme (far from mean / moving average)
- ✓ Old trend shows a final test (double top, H&S right shoulder, lower high)
- ✓ Convicted break of prior structural extreme — long trend bar(s), minimal tails
- ✓ Price pulls back (the new BC) — stays within the new structure
- ✓ Pullback is shallow; no return to the old trend territory
- ✓ Entry triggered on break beyond new B (completion of new ABCD)
- ✓ Stop placed beyond the highest point of the failed pullback
07 — The Journey
Mastery: Four Stages of Trader Development
Technical knowledge is a necessary but insufficient condition for trading success. The framework identifies four stages through which every trader must pass on the way to consistent profitability.
Unconscious Incompetence
The trader does not know what they do not know. Charts appear as random noise. This is the starting point for every trader — the danger zone where most account blow-ups occur.
Conscious Incompetence
The trader begins learning but recognises the gap between knowledge and application. This is the steepest and most emotionally challenging phase — confusion appears just before growth. Demo trading is essential at this stage.
Conscious Competence
The trader understands probability, follows process, and stops chasing trades. Decisions are correct but still require deliberate thought. Occasional mistakes occur but are recognised immediately. Small live account appropriate here.
Unconscious Competence
Trading becomes as natural as driving a familiar road. Entries, exits, and risk management decisions are executed without internal debate. The goal: emotionless, mechanical, and disciplined execution. Wealth follows naturally.
Mind Mastery: Trading in the Zone
Technical mastery alone is insufficient. Every trade must be approached in the right psychological state: confident, rational, and calm. The framework advocates pre-framing each trade as an athlete pre-frames a performance — visualising execution, reviewing the plan, and entering a state of focused clarity before acting. This is Mind Mastery: the highest-leverage skill in any trader's development.